The Feature Matrix Fallacy
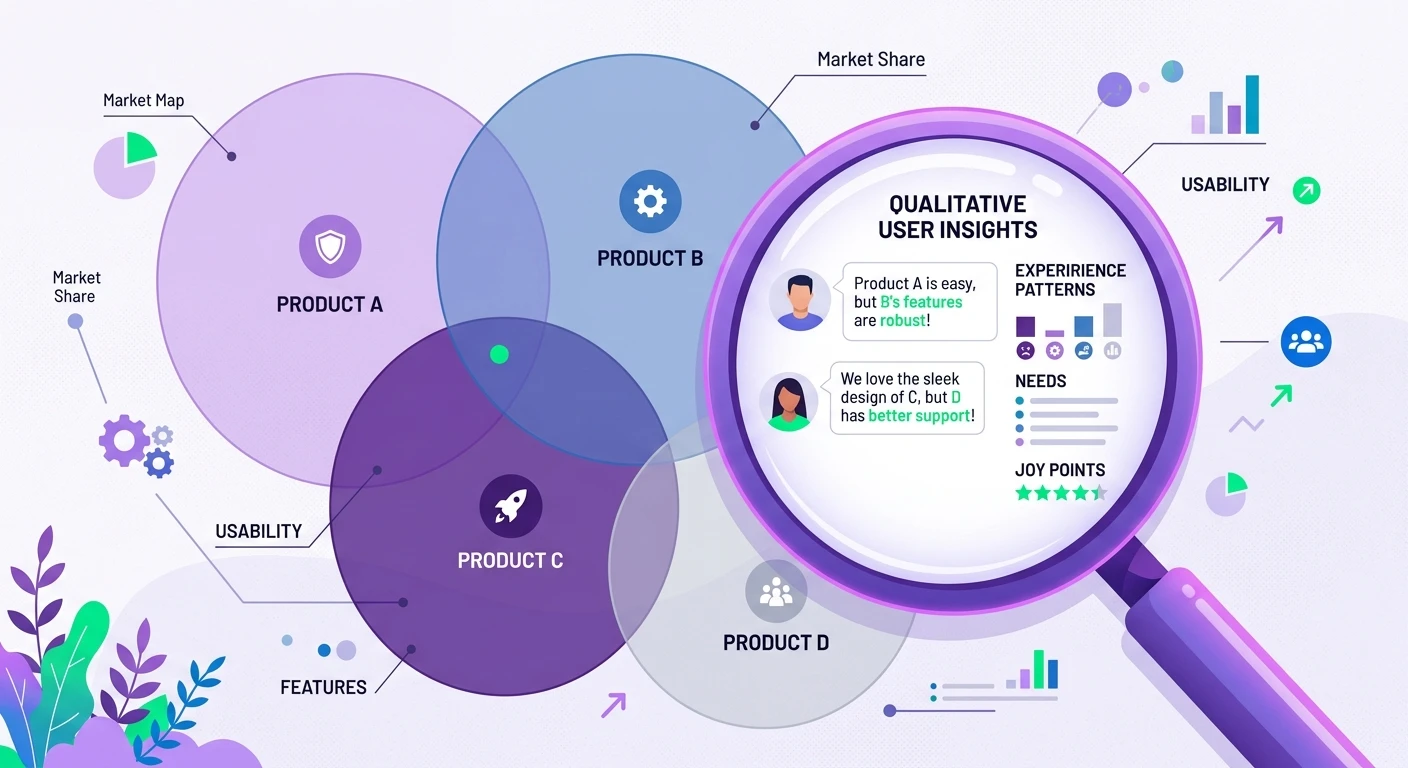
Every product team has built one: the competitive feature comparison spreadsheet. Rows of features, columns of competitors, cells filled with checkmarks and X marks. It feels thorough. It feels objective. And it tells you almost nothing about why customers choose one product over another.
Feature parity is table stakes in mature markets. When every CRM has contact management, every project tool has kanban boards, and every analytics platform has dashboards, the checkmark grid shows near-identical products. The differentiation that actually drives switching behavior lives in the qualitative layer -- the micro-interactions, the mental model alignment, the emotional responses that no feature matrix captures.
Competitive UX benchmarking adds that qualitative layer. Instead of asking "does Competitor X have feature Y," you ask "how do users experience the workflow that feature Y enables, and where does frustration or delight emerge?" The answers reshape competitive strategy in ways that quantitative benchmarks never could.
What Competitive UX Benchmarking Actually Looks Like
A proper competitive UX benchmark combines three research methods: comparative usability testing, experience interviews, and behavioral analysis.
Comparative usability testing puts the same task in front of users across multiple products. Not a feature walkthrough -- a realistic scenario that mirrors actual work. "You just received three customer complaints about the same issue. Find the pattern and escalate it to engineering." Watch how users navigate that workflow in your product versus two competitors. The task completion data matters less than the qualitative observations: where did users hesitate, what assumptions did the interface violate, what workarounds did they invent?
Experience interviews go deeper. These are structured conversations with users who have recently switched between competing products. The Jobs-to-Be-Done framework is particularly powerful here because switching decisions reveal the causal chain -- the push from the old product, the pull toward the new one, the anxieties about changing, and the habits that almost prevented the switch. This is intelligence that no survey can surface.
Behavioral analysis examines how users actually interact with competing products in their natural context. Diary studies capture longitudinal usage patterns -- when do users open each tool, what triggers them to switch between products during a workflow, where do they resort to manual processes because neither product handles the task well?
Moving Beyond NPS Comparisons
Net Promoter Score has become the default competitive metric, and it is dangerously misleading in isolation. A competitor with a higher NPS might have a more loyal user base with lower expectations. A competitor with a lower NPS might be disrupting the category in ways that temporarily frustrate users who are accustomed to the old paradigm.
The qualitative complement to NPS is understanding the narrative behind the number. When a user rates your competitor a 9 and your product a 7, the number tells you there is a gap. A well-designed interview tells you the gap is about onboarding friction that disappears after week two, or about a workflow that your product handles in three clicks versus their one. The gap might be temporary or structural, fixable in a sprint or fundamental to your architecture.
This is where AI-powered qualitative analysis changes the economics of competitive benchmarking. Traditionally, analyzing 30 comparative interviews across three competitors required weeks of manual coding. With AI-powered thematic analysis, the same dataset yields cross-product themes in hours. You can run competitive UX benchmarks quarterly instead of annually, turning competitive intelligence from a periodic report into a continuous discovery practice.
The Insight Advantage
Quantitative competitive data -- market share, feature counts, pricing tiers -- is available to everyone. Your competitors have the same access to those numbers that you do. Qualitative competitive intelligence is asymmetric. The team that understands why users experience frustration at step three of the competitor's onboarding flow has information the competitor's own product team might not have.
This asymmetry compounds. Each round of competitive UX benchmarking builds institutional knowledge about how users think about the category, what mental models they bring, and where the experience gaps create switching opportunities. This is the kind of strategic intelligence that transforms how teams make product decisions.
The teams that invest in qualitative competitive benchmarking do not just build better features. They build features that users actually want to switch for. And in a market where feature parity is the norm, that qualitative edge is the only sustainable competitive advantage.
Building Your Competitive UX Benchmarking Program
Start small. Pick your top two competitors and one critical workflow. Recruit 8-10 users who have experience with at least two of the three products. Run comparative sessions and experience interviews. Use AI-powered analysis to code themes across all sessions simultaneously.
The first round will surprise you. Not because you will discover your product is worse -- though you might -- but because you will discover that the competitive dynamics operate on dimensions you were not tracking. The competitor you feared for their feature set might be losing users because of cognitive load in their navigation. The competitor you dismissed might be winning because their error recovery experience reduces anxiety during high-stakes tasks.
Make it a quarterly practice. Each round builds on the previous one, tracking how competitive positions shift as products evolve. Over time, this becomes your most valuable strategic input -- not because it tells you what to build, but because it tells you what to build next.