Product teams have never had more data. Funnels, cohort analysis, heatmaps, session recordings, A/B test results, NPS scores, feature adoption curves -- the modern product analytics stack produces an overwhelming volume of behavioral signal. And most teams are drowning in it while still making bad decisions.
The problem is not the data. The problem is what the data cannot tell you.
Analytics shows you that 34% of users drop off at step three of your onboarding flow. It does not tell you that they dropped off because the terminology confused them, because they expected the integration to work differently based on a competitor they used previously, or because their manager told them to evaluate three tools and they already decided on a different one before they started.
Those three explanations lead to completely different product responses. The first is a copywriting fix. The second is a positioning problem. The third means your onboarding is irrelevant -- the real battle was lost before the user ever signed up. Analytics gives you one number. The qualitative context gives you three divergent strategies.
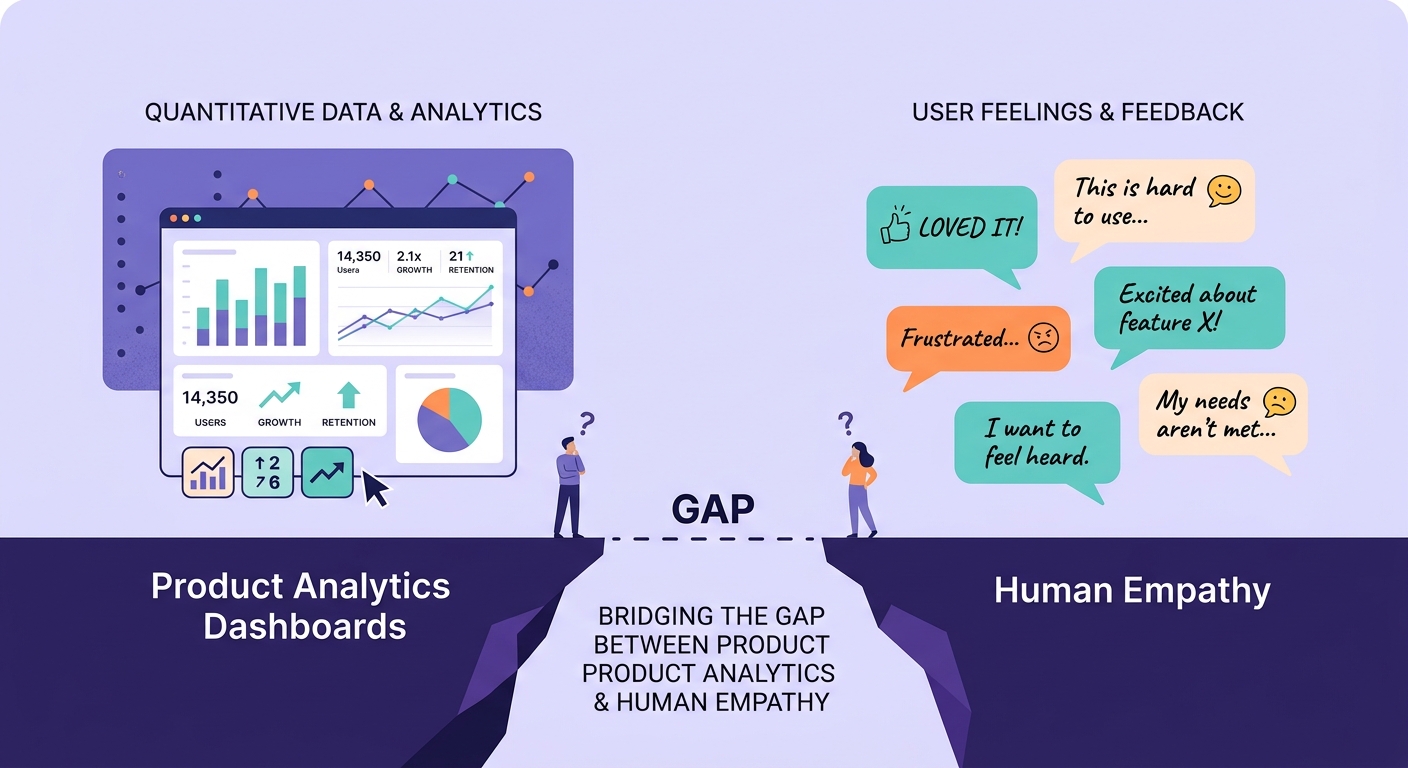
This is the empathy gap: the distance between knowing what users do and understanding why they do it. Every product team has it. Few acknowledge it. Fewer still close it systematically.
The Dashboard Confidence Trap
Dashboards create a dangerous sense of certainty. When you see a number -- 34% drop-off, 2.3x improvement, 78 NPS -- it feels like knowledge. It feels like you understand what is happening. The precision of the number creates an illusion of precision in your understanding.
But metrics are summaries. They compress complex human behavior into single data points. That compression is useful for tracking trends and spotting anomalies, but it is catastrophic for making product decisions that depend on understanding motivation, context, and meaning.
I have watched product teams spend months optimizing a metric that was moving for reasons completely unrelated to their changes. A team improved their activation rate by 12% and celebrated, only to discover through qualitative research with actual users that the improvement came from a change in their marketing channel mix that brought in more motivated users -- not from the onboarding improvements they shipped.
The dashboard showed improvement. The dashboard was not wrong. But the team's interpretation was completely wrong, and they drew conclusions about their product that were not supported by the evidence. They just could not see the gap because the number looked right.
This happens more often than anyone admits. Product analytics is excellent at measuring outcomes. It is terrible at explaining causes. And product decisions require understanding causes.
Where Analytics Systematically Fails
There are specific categories of product questions where analytics is not just incomplete but actively misleading.
Motivation and intent. Why did the user click that button? Analytics sees a click event. The user might have been exploring, might have been confused, might have been looking for something else entirely and clicked the closest thing to what they expected. A well-designed qualitative interview reveals intent. A click event does not.
Emotional response. A user who completes a task in frustration looks identical in your analytics to a user who completes it with delight. Both show as successful completions. The frustrated user is about to churn. The delighted user is about to become an advocate. Your funnel cannot tell them apart.
Competitive context. Analytics shows you your product in isolation. Users experience your product in the context of alternatives. They are constantly comparing, evaluating, and deciding whether to stay or switch. As we explored in our analysis of user research versus market research, understanding the competitive frame your users operate in requires qualitative methods -- there is no event you can fire that captures "I just saw a demo of your competitor and now I am reconsidering."
Workarounds and adaptation. Sophisticated users route around your product's limitations. They export data to spreadsheets, use browser extensions, copy-paste between tools. Analytics sees lower engagement with certain features. The reality is that users have found alternatives because your features do not work for their actual workflow. You cannot see what happens outside your product boundary.
Social and organizational dynamics. The person using your product is often not the person who decided to buy it, and neither of them is the person who will decide to renew. Enterprise product decisions involve multiple stakeholders with different motivations, different definitions of success, and different levels of influence. Analytics sees individual user behavior. It is blind to the organizational context that actually determines retention and expansion.
The Synthesis Problem
The empathy gap is not just about collecting qualitative data. Many teams do run occasional user interviews or send out surveys with open-ended questions. The deeper problem is synthesis -- turning qualitative insight into something that integrates with quantitative data to produce better decisions.
Most teams treat qualitative and quantitative research as separate activities. The analytics team produces dashboards. The research team produces reports. The two outputs live in different tools, use different vocabularies, and inform different meetings. Integration happens informally, in the minds of individual product managers, if it happens at all.
This is where the principles of combining qualitative and quantitative research become essential. The most effective product teams do not just run both types of research -- they design them to inform each other. Quantitative data identifies where to look. Qualitative research explains what you are seeing. The quantitative data then validates whether the qualitative insight applies at scale.
But synthesis at scale is hard. A product team generating hundreds of interview transcripts alongside terabytes of behavioral data cannot manually integrate those streams. This is where AI-powered qualitative analysis becomes transformative -- not replacing human judgment, but enabling researchers to work at a scale that makes genuine mixed-methods product research practical. Tools that can analyze open-ended responses at scale without losing the nuance bridge the gap between the depth of qualitative research and the breadth of quantitative analysis.
Closing the Gap: A Practical Framework
Closing the empathy gap does not require abandoning analytics or doubling your research budget. It requires changing how you use the data you already have and adding targeted qualitative research at the moments where analytics leaves you guessing.
Instrument curiosity, not just conversion. When your analytics shows an anomaly -- a surprising drop, an unexpected spike, a segment behaving differently than predicted -- resist the urge to immediately hypothesize from the data. Instead, flag it as a qualitative research question. Build the discipline of saying "we see X happening, and we do not yet know why" before jumping to solutions.
Run qualitative sprints on quantitative triggers. Set thresholds on key metrics that automatically trigger qualitative investigation. If activation drops below a threshold, conduct five rapid user interviews within 48 hours. If a feature adoption rate plateaus, run a diary study to understand how the feature fits (or does not fit) into real workflows. The approach to continuous discovery works best when quantitative signals determine where to focus qualitative effort.
Build empathy artifacts, not just insight reports. The output of qualitative research should not be a slide deck that gets presented once and forgotten. It should be persistent artifacts -- journey maps, persona updates, job-story libraries -- that live alongside your analytics dashboards and are referenced in the same product decisions. When someone looks at the conversion funnel, the qualitative context for each stage should be immediately accessible.
Democratize qualitative access. The empathy gap widens when qualitative research is locked inside a research team that publishes quarterly reports. It narrows when engineers, designers, and product managers can directly access user voice data. Building a research repository that teams actually use transforms qualitative research from an occasional input into a continuous resource that keeps the entire product team connected to user reality.
Close the feedback loop. After shipping a change based on quantitative data, do not just measure the quantitative outcome. Go back to users and understand whether the change addressed their actual problem. This single practice -- qualitative validation of quantitative wins -- catches the dashboard confidence trap before it compounds into months of misguided iteration.
The Competitive Advantage of Understanding
The teams that close the empathy gap do not just build better products. They build them faster, because they waste less time on changes that look good in dashboards but do not actually solve user problems.
In a world where every team has access to the same analytics tools, the same A/B testing frameworks, and the same product metrics playbooks, the differentiator is not better measurement -- it is deeper understanding. The teams that know why their users behave the way they do will consistently outperform the teams that only know what their users do.
Analytics infrastructure has matured dramatically in the past decade. Qualitative research infrastructure is having its moment now, with AI transforming how teams process and synthesize qualitative data at speeds that were impossible even two years ago. The empathy gap is no longer a resource constraint -- it is a strategic choice.
Choose to close it.