The Broken Promise of Mixed-Methods Research
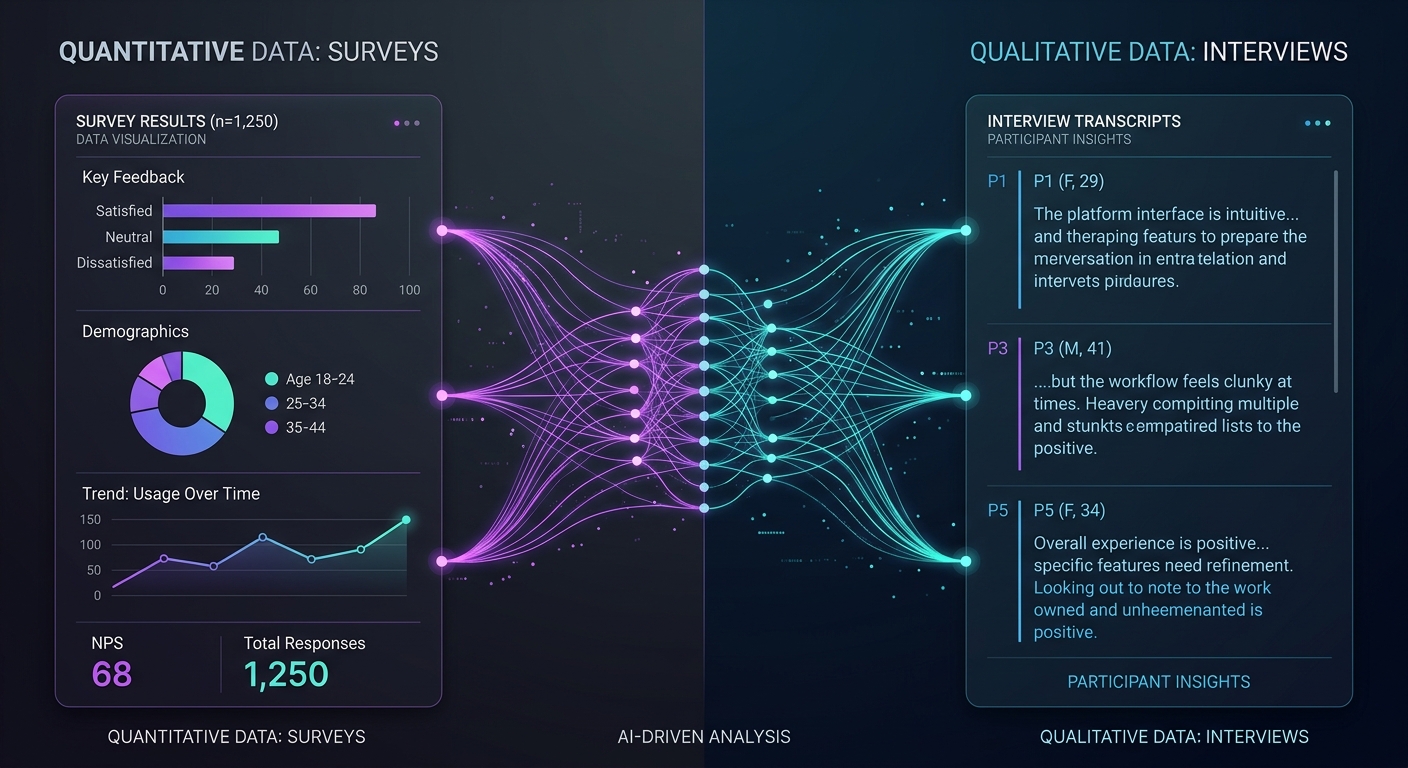
Mixed-methods research is the gold standard for understanding complex human behavior. Combining quantitative breadth (surveys, analytics, structured data) with qualitative depth (interviews, open-ended responses, observational data) should give you a 360-degree view of your research question.
In theory, it does. In practice, most mixed-methods projects collapse under their own weight.
A 2024 study in the Journal of Mixed Methods Research found that 68% of mixed-methods projects experience significant delays due to tooling and workflow fragmentation. Researchers juggle SurveyMonkey for distribution, Zoom for interviews, Otter.ai for transcription, NVivo or Atlas.ti for coding, Excel for quant analysis, and some combination of Google Docs and sticky notes to synthesize it all.
The result? Data lives in silos. Integration happens manually (if it happens at all). And the "mixed" part of mixed-methods becomes an afterthought — a paragraph in the limitations section rather than a genuine analytical strategy.
This guide is for researchers, UX teams, product managers, and insights professionals who want mixed-methods to actually deliver on its promise. We will cover why the traditional approach fails, how AI fundamentally changes the equation, and how to implement three proven frameworks — sequential explanatory, concurrent triangulation, and embedded designs — using a unified platform.
Why Mixed-Methods Fails: The Tooling Fragmentation Problem
Let us be direct about the root cause. Mixed-methods does not fail because the methodology is flawed. It fails because the infrastructure does not support it.
The Tool-Switching Tax
Every time a researcher moves data between platforms, three things happen:
- Context is lost. A survey response that prompted a follow-up interview loses its connection when the interview transcript lives in a different system.
- Time is wasted. Manual export, import, cleaning, and reformatting consume 30-40% of total project time according to research operations benchmarks.
- Integration becomes optional. When connecting datasets requires heroic manual effort, teams default to presenting quant and qual findings side by side rather than genuinely integrating them.
The Coding Bottleneck
Qualitative coding — the process of tagging themes, patterns, and categories in text data — is where most mixed-methods projects stall. A single 60-minute interview generates 8,000-10,000 words of transcript. Coding that transcript manually takes 4-6 hours for an experienced researcher.
Scale that to 20 interviews plus 500 open-ended survey responses, and you are looking at 200+ hours of coding work before you even begin synthesis. Most teams do not have that capacity. So they cut corners: they code a subset, they use surface-level categories, or they skip qualitative coding entirely and just pull representative quotes.
None of those shortcuts produce rigorous mixed-methods findings.
The Synthesis Gap
Even teams that successfully collect and code both quantitative and qualitative data face the hardest challenge: genuine synthesis. True mixed-methods integration means more than presenting two sets of findings. It means using one dataset to explain, expand, or challenge the other.
This requires holding both datasets in view simultaneously — seeing that the 34% of survey respondents who reported dissatisfaction with onboarding are the same population whose interview transcripts reveal confusion about pricing tiers. That kind of connection is nearly impossible when your data lives across five platforms.
How AI Changes the Mixed-Methods Equation
AI does not just speed up existing workflows. It removes the structural barriers that made mixed-methods impractical for most teams.
Automated Qualitative Coding
Modern large language models can code qualitative data with remarkable consistency. Research published in 2025 comparing AI-assisted coding to expert human coding found inter-rater reliability scores (Cohen's kappa) of 0.78-0.85 — comparable to agreement between two trained human coders.
This is not about replacing human judgment. It is about eliminating the bottleneck. When AI handles the first pass of coding, researchers spend their time reviewing, refining, and interpreting rather than tagging transcripts line by line.
At Qualz.ai, our 14-lens analysis framework applies multiple analytical perspectives simultaneously — thematic analysis, sentiment mapping, contradiction detection, jobs-to-be-done extraction, and more. What used to take weeks of manual coding happens in minutes, with full transparency into how each code was assigned.
Cross-Method Synthesis
This is where AI creates genuinely new capability. When surveys and interviews live in the same platform, AI can automatically surface connections between quantitative patterns and qualitative explanations.
For example: your survey data shows that NPS drops sharply for users in their second month. Your interview data contains a cluster of codes around "feature discovery frustration." An AI synthesis engine connects these datasets and generates a hypothesis: second-month churn correlates with users hitting the limits of their initial use case without discovering adjacent features.
That connection might take a human analyst days to find. AI surfaces it in seconds — not as a conclusion, but as a testable hypothesis for the research team to evaluate.
Dynamic Research Design
Traditional mixed-methods requires researchers to commit to a design upfront: collect quant first, then qual (sequential), or both simultaneously (concurrent). AI enables a more fluid approach. As quantitative data comes in, AI can identify segments that warrant deeper qualitative exploration and even generate targeted interview guides on the fly.
This is not theoretical. Teams using AI-powered research platforms report 40-60% reductions in time-to-insight compared to traditional multi-tool workflows.
Three Practical Frameworks for AI-Powered Mixed-Methods
Theory is useful, but you need actionable frameworks. Here are three proven mixed-methods designs adapted for AI-powered platforms, with step-by-step implementation guidance.
Framework 1: Sequential Explanatory Design
What it is: Collect and analyze quantitative data first, then use qualitative methods to explain the patterns you find.
When to use it: You have a clear quantitative signal (declining retention, unexpected survey results, usage pattern anomalies) and need to understand the "why" behind the numbers.
How to implement it with AI:
Phase 1 — Quantitative Collection (Days 1-3)
Deploy a structured survey targeting your population of interest. Include a mix of scaled questions (Likert, NPS, satisfaction ratings) and 2-3 open-ended questions for initial qualitative signal.
In Qualz.ai, you build and deploy this survey directly in the platform. Responses stream in and quantitative analysis begins immediately — segmentation, cross-tabulation, statistical significance testing.
Phase 2 — AI-Powered Pattern Detection (Day 4)
Before designing your qualitative phase, let AI analyze the quantitative results. The platform identifies statistically significant segments, outlier groups, and unexpected correlations. It also performs initial thematic coding on open-ended survey responses.
Key output: a set of quantitative findings that need qualitative explanation. For example: "Users aged 25-34 report 2.3x higher satisfaction with feature X than users aged 35-44. Open-ended responses suggest different mental models, but the survey data alone cannot explain the mechanism."
Phase 3 — Targeted Qualitative Deep-Dive (Days 5-10)
Based on Phase 2 findings, design your qualitative data collection. This is where AI-moderated interviews become powerful. The platform generates interview guides tailored to the specific patterns you need to explore.
AI interviews adapt in real-time — when a participant mentions a concept related to your quantitative findings, the AI probe goes deeper. It does not follow a rigid script. It follows the research question.
Phase 4 — Integrated Synthesis (Day 11)
With both datasets in the same platform, AI performs cross-method synthesis. It maps qualitative themes to quantitative segments, identifies where qualitative findings confirm versus challenge quantitative patterns, and generates an integrated findings report.
Your team reviews, challenges, and refines. Total project time: 11 days instead of 6-8 weeks.
Framework 2: Concurrent Triangulation Design
What it is: Collect quantitative and qualitative data simultaneously, then compare and contrast findings to build a more complete picture.
When to use it: You are exploring a new problem space and want maximum breadth and depth from the start. Common in product discovery, market entry research, and UX studies for startups and growth-stage companies.
How to implement it with AI:
Parallel Collection Streams
Launch two data collection efforts simultaneously:
Stream A — Quantitative Survey: Large-sample survey (n=300+) with structured questions covering attitudes, behaviors, demographics, and satisfaction metrics. Include 3-5 open-ended questions for qualitative triangulation points.
Stream B — AI Interviews: Targeted interviews with a smaller sample (n=15-30) exploring the same research questions in depth. AI-moderated interviews can run 24/7 in multiple languages, dramatically increasing your qualitative sample size compared to traditional approaches.
Both streams run concurrently within the same platform. As data flows in, the 14-lens analysis framework codes qualitative data in real-time while quantitative dashboards update automatically.
Convergence Analysis
This is the critical step that most teams skip when using separate tools. In a unified platform, convergence analysis becomes systematic rather than ad hoc.
The AI comparison engine examines:
- Convergence: Where do quant and qual findings agree? (Strengthens confidence)
- Complementarity: Where does one method fill gaps left by the other? (Expands understanding)
- Divergence: Where do findings contradict? (Reveals complexity)
Divergence is the most valuable finding in triangulation. When your survey says users are satisfied but interviews reveal deep frustration, you have discovered something important about the gap between stated and revealed preferences.
Practical Example
A B2B SaaS company used concurrent triangulation to understand why trial-to-paid conversion was declining despite high trial engagement scores.
Survey data (n=412) showed: 78% trial satisfaction, strong feature ratings, NPS of 42 during trial.
AI interviews (n=24) revealed: Users loved the product but could not build an internal business case. The value was experiential — easy to feel, hard to quantify for procurement.
The synthesis: High satisfaction masked a positioning problem. The product delivered value users could experience but not articulate to budget holders. The fix was not product improvement but sales enablement — giving champions quantifiable ROI data to bring to procurement meetings.
That insight emerged specifically because the two methods were analyzed together, not in separate reports.
Framework 3: Embedded Design
What it is: One method is embedded within a study primarily driven by the other method. Typically, a qualitative component is embedded within a larger quantitative study (or vice versa).
When to use it: You have a primary research method but need supplementary data from the other paradigm to address a specific sub-question. Common in enterprise research programs that run continuous quantitative tracking but need periodic qualitative deep-dives.
How to implement it with AI:
Primary Quantitative Framework with Qualitative Embedding
Set up a continuous survey program — quarterly CSAT, monthly product feedback, or ongoing NPS tracking. This is your primary data stream.
Within this quantitative framework, embed qualitative triggers:
- Score-based triggers: When a respondent gives an NPS of 0-3, automatically invite them to an AI-moderated interview exploring their dissatisfaction.
- Segment-based triggers: When you accumulate 50+ responses from a new market segment, trigger a qualitative deep-dive with 8-10 AI interviews targeting that segment.
- Anomaly-based triggers: When AI detects a statistically significant shift in any metric, automatically generate and deploy a targeted interview guide to investigate.
The AI Advantage in Embedded Design
Traditional embedded designs require manual monitoring of quantitative data to know when qualitative investigation is warranted. AI automates this entirely.
The platform continuously analyzes incoming quantitative data. When it detects patterns that warrant qualitative exploration — a sudden drop in satisfaction for a specific segment, an unexpected correlation between two variables, or a new theme emerging in open-ended responses — it can automatically initiate the qualitative component.
This transforms embedded design from a planned, periodic activity into a responsive, always-on research capability. Your research program adapts to signals in the data rather than operating on a fixed schedule.
The 14-Lens Analysis Framework: Going Beyond Basic Coding
A key differentiator in AI-powered mixed-methods is the depth of qualitative analysis. Basic automated coding assigns themes to text. That is table stakes. The 14-lens analysis framework applies multiple analytical perspectives simultaneously:
- Thematic Analysis — Core themes and patterns across responses
- Sentiment Mapping — Emotional valence at the statement level, not just overall
- Contradiction Detection — Where participants say one thing but imply another
- Jobs-to-Be-Done Extraction — Underlying motivations and desired outcomes
- Pain Point Hierarchy — Severity and frequency ranking of identified problems
- Decision Driver Analysis — Factors influencing choices and preferences
- Behavioral Pattern Recognition — Recurring actions and workflows described by participants
- Expectation Gap Analysis — Differences between expected and actual experiences
- Language Pattern Analysis — Recurring phrases, metaphors, and framing devices
- Stakeholder Impact Mapping — How different roles and personas experience the same phenomenon
- Temporal Analysis — How experiences and perceptions change over time
- Comparative Analysis — Systematic comparison across segments, cohorts, or conditions
- Root Cause Analysis — Causal chains and underlying systemic factors
- Opportunity Identification — Unmet needs and potential solution spaces
When these 14 lenses are applied to both survey open-ends and interview transcripts within the same platform, the depth of insight is qualitatively different from what any single-tool workflow can produce.
Implementation Checklist: Getting Started
If you are ready to move from fragmented mixed-methods to a unified AI-powered approach, here is your practical starting point:
Week 1: Audit Your Current Workflow
- Map every tool currently used in your research workflow
- Identify the specific points where data transfer or context loss occurs
- Calculate the time spent on manual coding, transcription, and synthesis
- Document the integration steps you skip due to time constraints
Week 2: Design Your First Unified Study
- Choose one of the three frameworks above based on your research question
- Define your quantitative and qualitative components
- Identify where AI can replace manual steps (coding, synthesis, interview moderation)
- Set clear integration points — the specific moments where quant and qual data should inform each other
Week 3: Execute and Iterate
- Deploy your study in a unified platform
- Monitor AI coding quality and calibrate as needed
- Review cross-method synthesis outputs critically — AI surfaces connections, humans validate them
- Document time savings and insight quality compared to your previous workflow
Ongoing: Build Your Mixed-Methods Muscle
- Start with sequential explanatory (easiest to implement)
- Progress to concurrent triangulation as your team builds confidence
- Implement embedded design for continuous research programs
- Train your team on interpreting AI-generated synthesis rather than just reviewing raw data
The ROI Case for Unified Mixed-Methods
For research leaders making the case to stakeholders, here are the numbers that matter:
Time Reduction
- Manual qualitative coding: 85-90% reduction (from 6 hours per transcript to 30 minutes of review and refinement)
- Cross-method synthesis: 70-80% reduction (from days of manual analysis to hours of AI-assisted review)
- Total project timeline: 50-65% reduction (from 6-8 weeks to 2-3 weeks for a standard mixed-methods study)
Quality Improvement
- Coding consistency: Inter-rater reliability of 0.78-0.85 (comparable to expert human coders)
- Integration depth: 100% of data integrated vs. typical 40-60% with manual approaches
- Analytical breadth: 14 simultaneous analytical lenses vs. 2-3 in typical manual analysis
Scale
- Interview capacity: 24/7 AI-moderated interviews in 30+ languages vs. limited by researcher availability
- Survey analysis: Real-time coding of open-ended responses vs. batch processing after collection closes
- Continuous research: Always-on embedded designs vs. periodic planned studies
These are not incremental improvements. They represent a fundamental shift in what is possible with mixed-methods research.
Moving Forward
Mixed-methods research has always promised more than it could deliver — not because the methodology was wrong, but because the tools were not built for integration. AI changes that equation entirely.
The frameworks in this guide — sequential explanatory, concurrent triangulation, and embedded design — are not new. They are well-established in methodological literature. What is new is the ability to execute them efficiently, rigorously, and at scale within a single platform.
Whether you are a startup running your first customer discovery study, an enterprise research team managing a continuous insights program, or an academic researcher pushing the boundaries of mixed-methods methodology, the tools now exist to make genuine integration the default rather than the exception.
The question is no longer whether mixed-methods is worth the effort. It is whether you can afford to keep making decisions based on only half the picture.
Ready to run your first AI-powered mixed-methods study? Book a demo and see how Qualz.ai unifies surveys, AI-moderated interviews, and 14-lens analysis in one platform. We will walk through your specific research design and show you exactly how it maps to our workflow.