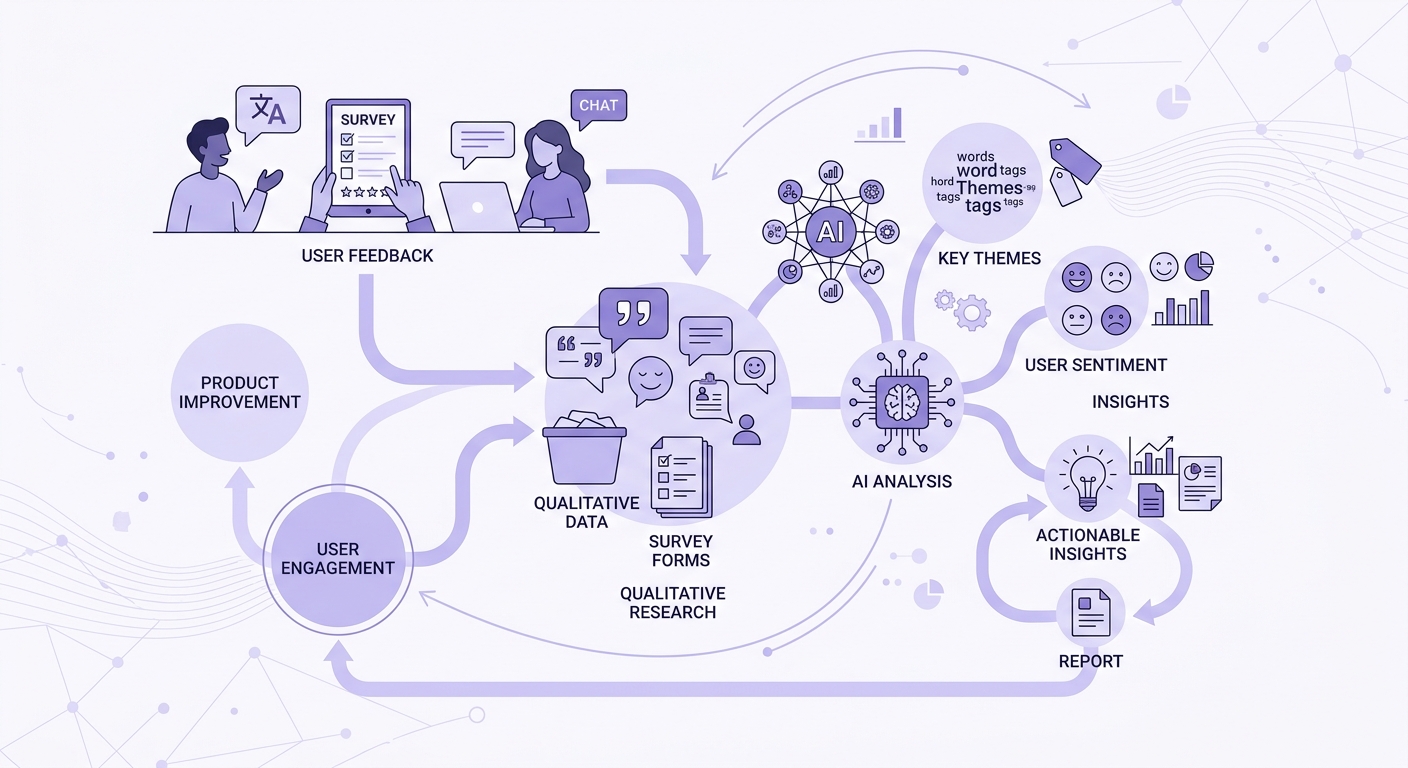
You ran a solid study. Recruited the right participants. Asked the right questions. Spent days in qualitative analysis synthesizing themes. Built a clean slide deck with key findings, supporting quotes, and a neat recommendations section.
You present it to the product team. They nod. They say "this is really helpful." They ask one polite question. And then nothing happens. The findings sit in a shared drive. The roadmap does not change. The same decisions get made the same way they were going to be made before your research existed.
This is the most common failure mode in user research — not bad methodology, but failed translation. The research is sound. The delivery is wrong. And the gap between a finding and a product decision is where most research impact goes to die.
If this pattern sounds familiar, the problem is almost certainly not your research. It is how you are packaging and presenting it.
Why Most Research Presentations Fail
The standard research readout follows an academic template: background, methodology, findings, recommendations. This structure makes perfect sense to researchers. It is also almost perfectly designed to lose product stakeholders.
Here is why.
Product managers do not care about methodology. They assume you did the research correctly. Leading with sample size, recruitment criteria, and analysis approach signals thoroughness to fellow researchers and signals "this will be long" to everyone else. Methodology belongs in an appendix, not a preamble.
Findings organized by theme miss the decision context. Researchers naturally organize findings by what emerged from the data — thematic clusters, affinity groups, pattern categories. But product teams do not think in themes. They think in decisions: what should we build next, what should we cut, where should we invest. If your findings do not map to pending decisions, they float in limbo.
Recommendations without stakes feel optional. "Consider improving the onboarding flow" is a recommendation. "Our enterprise customers are abandoning onboarding at step 3 at a rate that costs approximately $400K in annual recurring revenue" is a business case. One gets a nod. The other gets a sprint.
Too many findings dilute all of them. Researchers want to be comprehensive. They surface everything the data revealed. But a deck with 15 findings has zero findings, because no stakeholder can prioritize across that many inputs. The researcher's job is not to present everything — it is to curate what matters most given the team's current decision context.
The Decision-First Presentation Framework
Flip the structure. Instead of building from data up to recommendations, build from decisions down to evidence.
Step 1: Identify the Pending Decisions
Before you even start the analysis, know what decisions the product team is currently facing. What is on the roadmap for next quarter? What bets are they considering? Where are they uncertain?
The best research presentations answer questions that stakeholders are actively asking. If no one is asking the question your research answers, you either need to create urgency around the question or reframe your findings around questions they are asking.
Step 2: Lead With the Headline
Start your presentation with a single slide that states the most important thing you learned in plain language. Not research-speak. Not hedged conclusions. A clear, direct statement that a product manager could repeat in their next planning meeting.
Bad: "Participants exhibited varied onboarding completion patterns with notable friction at configuration steps."
Good: "Enterprise buyers cannot complete setup without help from their sales rep. Self-serve onboarding is broken for accounts over 50 seats."
The headline should create either relief (we are on the right track) or tension (we need to change course). If it does neither, it is not a headline — it is a summary.
Step 3: Structure Findings as Decisions, Not Themes
Instead of grouping findings by what emerged from the data, group them by what the team needs to decide.
Thematic structure: "Theme 1: Onboarding Confusion. Theme 2: Pricing Perception. Theme 3: Feature Discovery."
Decision structure: "Decision 1: Should we invest in self-serve enterprise onboarding? Decision 2: Should we restructure pricing tiers? Decision 3: Should we prioritize feature education over feature development?"
For each decision, present the evidence from your research that informs it. Include the specific user quotes, behavioral patterns, and data points that support or complicate the decision. This structure turns a passive readout into an active working session.
Step 4: Quantify Where You Can
Stakeholders live in a world of metrics, OKRs, and business cases. Research findings that connect to numbers get taken seriously. Findings that stay purely qualitative get appreciated but not acted on.
You do not need hard revenue projections. But you should estimate where possible:
- "7 of 12 participants could not complete this task" tells the team the success rate is roughly 40 percent.
- "This friction point appears in our three largest account segments" signals revenue exposure.
- "Participants spent an average of 8 minutes on a task designed to take 30 seconds" quantifies the pain.
As we explored in our guide on the empathy gap in product analytics, numbers without context mislead. But context without numbers gets ignored. The art is combining both.
Step 5: Make Trade-offs Explicit
Product decisions always involve trade-offs. The most useful research presentations make those trade-offs visible rather than pretending every finding has a clean solution.
"Fixing self-serve onboarding will require 6 weeks of engineering time and may reduce the high-touch sales experience that current enterprise customers value."
"Simplifying pricing would address confusion but risks leaving money on the table with power users who currently buy the premium tier."
When you name the trade-offs, you position yourself as a strategic partner rather than a researcher delivering a report. You are helping the team think, not just informing them.
The Delivery Mechanics That Matter
Show Video Clips, Not Just Quotes
A text quote on a slide is evidence. A 30-second video of a real user struggling with your product is conviction. If your research platform supports real-time transcription, use it to identify the most compelling moments and clip them for your presentation.
Video works because it bypasses the abstraction layer. Stakeholders are not reading a researcher's interpretation of what happened. They are watching it happen. The emotional impact of seeing a customer fail at a task your team designed is worth more than any number of bullet points.
Distribute a Pre-Read, Present the Discussion
Send the full findings document 24 hours before the meeting. Then use the meeting time not to walk through slides but to facilitate a discussion about implications and next steps.
This approach respects everyone's time and shifts the meeting from information transfer to decision making. It also forces you to write findings that are clear enough to stand on their own without your narration — which is a quality bar that improves the work itself.
Create a One-Page Decision Brief
In addition to the full presentation, create a single-page document that a VP could read in two minutes and understand the key findings and their implications. This brief is what travels through the organization after your meeting. It is what gets forwarded to executives who were not in the room. It is how your research reaches the people who actually allocate resources.
The brief should include: the primary question you investigated, the top 3 findings, the recommended action with estimated impact, and the key trade-off to consider.
Building Ongoing Influence
Single presentations create single moments of impact. Sustained research influence requires embedding your findings into the team's ongoing decision processes.
Maintain a research repository where findings are searchable and connected to product areas. When a PM is scoping a project related to onboarding, they should be able to pull up every relevant finding from the last 12 months in seconds.
Attend sprint planning and roadmap reviews — not to present, but to connect dots. "This initiative relates to something we found in Q2 research" is more powerful than a standalone presentation because it meets the team in their decision context.
Collaborate with data analysts to connect qualitative findings to quantitative outcomes. When you can show that the UX issues your research identified correlate with the conversion drops the data team measured, both teams become more credible.
The Mindset Shift
The researchers who consistently influence product decisions share a mindset: they see their job as changing decisions, not producing reports.
This sounds obvious. It is not. Most research workflows are optimized for methodological rigor and comprehensive coverage — producing the most thorough possible account of what users said and did. These are important. But they are inputs to the actual goal, which is making better product decisions.
When you orient around decision impact, everything changes. You recruit participants who represent the segments the team is deciding about. You focus analysis on the themes that connect to pending decisions. You structure your deliverables around what needs to change, not what you found.
The research does not get less rigorous. It gets more relevant. And relevance is what turns polite nods into changed roadmaps.
The next time you prepare a research readout, ask yourself one question: if a product manager remembers exactly one thing from this presentation and acts on it, what should that one thing be? Start there. Build outward. And watch what happens when research stops being a report and starts being a catalyst.