This guide provides a walkthrough on how to do the Saturation & Coverage Gauge Lens analysis with Qualz.ai. This lens is ideal for researchers who need to assess conceptual saturation, identify underrepresented voices, and ensure comprehensive coverage in qualitative studies.
Step 1: Prepare Your Interview Transcripts
To get started with Saturation & Coverage Gauge Lens analysis, you’ll need transcripts of interviews uploaded into your Qualz.ai workspace. You can do this in two ways:
- Use AI-Moderated Interviews: If you have conducted interviews using Qualz.ai’s AI-Moderated Interview feature, transcripts are automatically generated, saving you significant time and effort. Ensure these sessions are marked as complete.
- Upload Existing Transcripts: For interviews conducted manually or transcribed elsewhere, you can easily upload your transcript files. Qualz.ai supports various common formats, including DOCX, PDF, and TXT. Navigate to the appropriate section in the platform to upload and process these files.
Step 2: Navigate to the “Run Analysis” Section
With your transcripts prepared, you can initiate the analysis process
- Click on the “Run Analysis” tab in the top menu.
- The “Run Analysis” area provides the option to select the type of lens for the analysis.
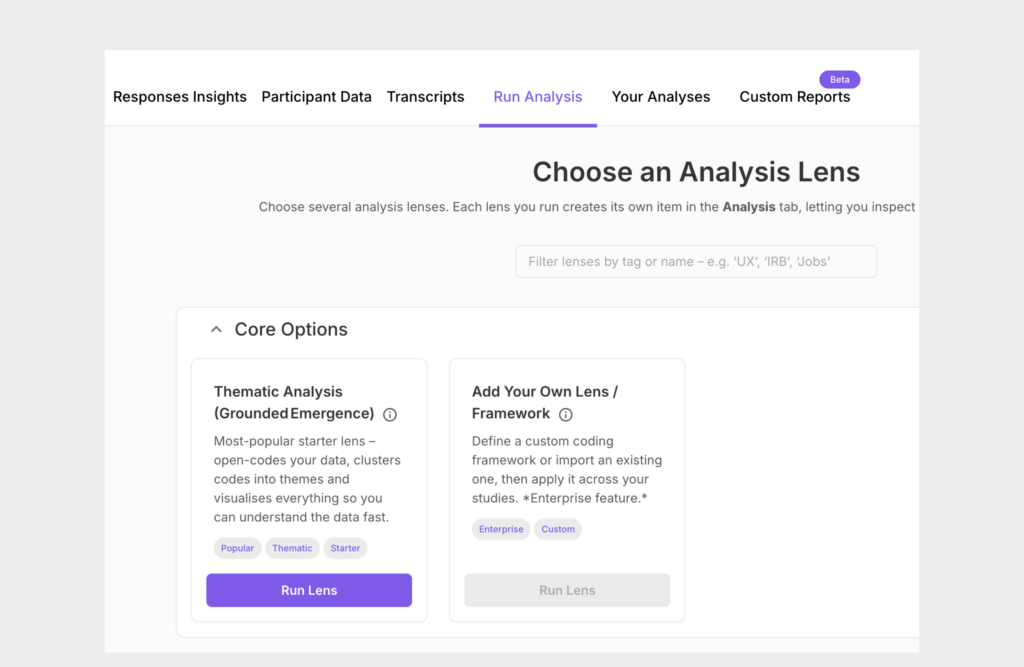
Step 3: Select a Lens and Your Interview Transcript
You can choose from multiple lens types, such as
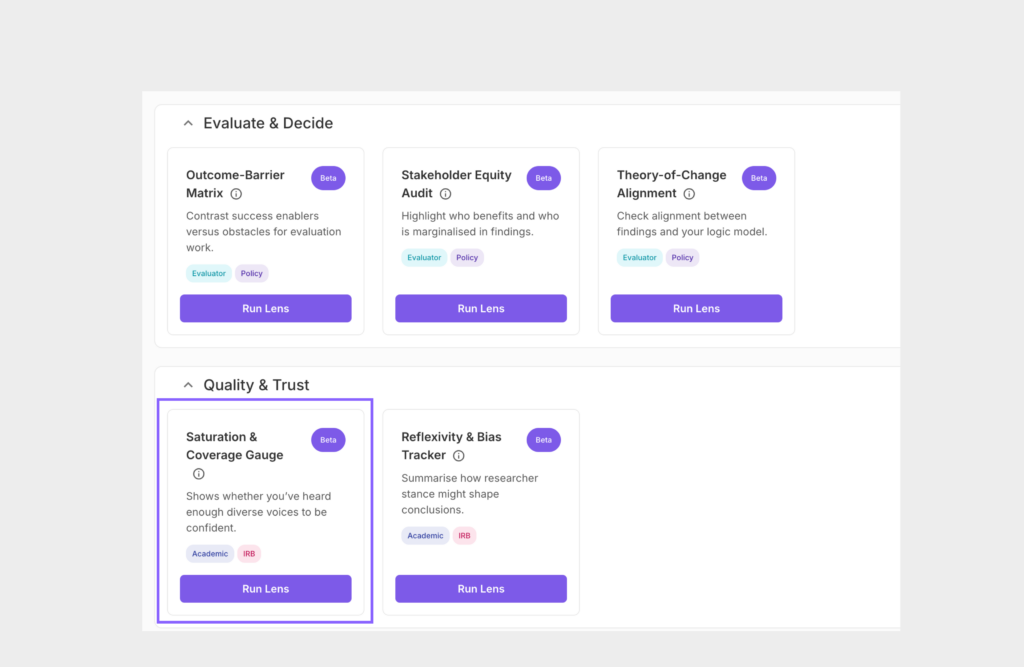
Here, we have selected the Saturation & Coverage Gauge Lens.
- Click on Run Lens to get started
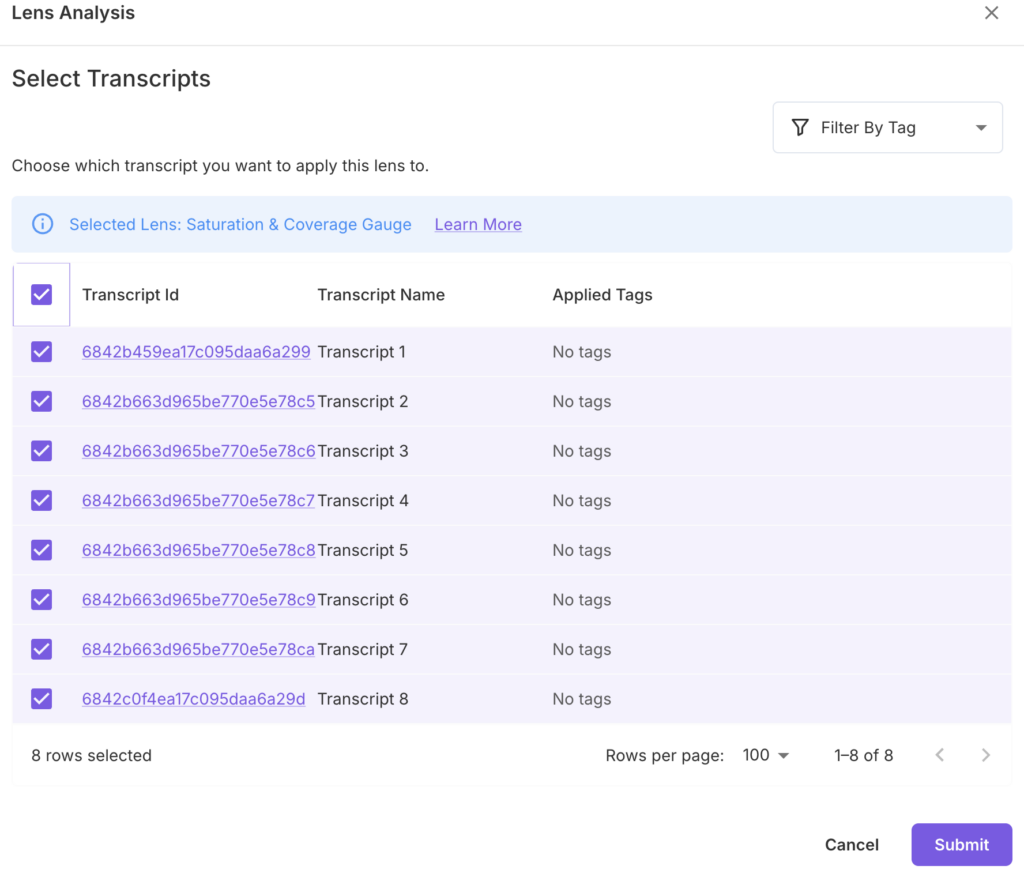
- Check the box next to each transcript you wish to analyze.
- Click the Submit button to run the analysis.
Step 4: View the Results in “Your Analyses”
Go to the “Your Analyses” tab to view your completed analysis.
With Qualz.ai’s Saturation & Coverage Gauge Lens, you can evaluate the conceptual depth, diversity, and completeness of your dataset at a glance.
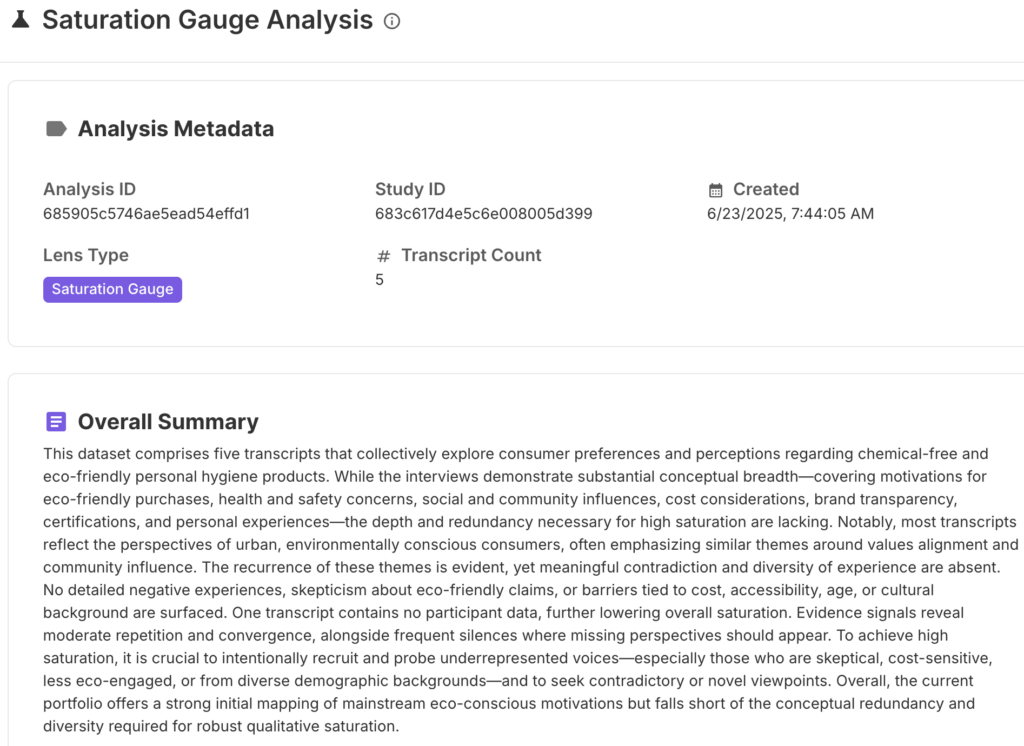
This lens delivers an overall saturation score (e.g., low, medium, or high) reflecting how thoroughly your data captures the topic.
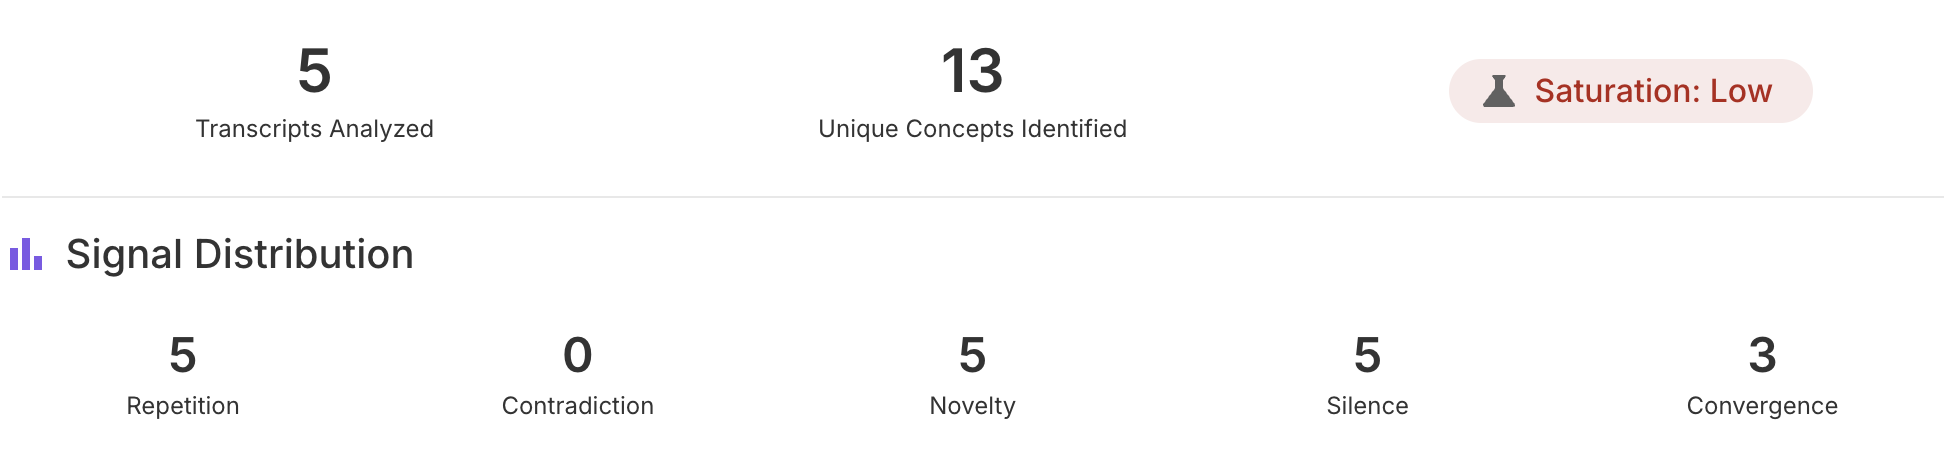
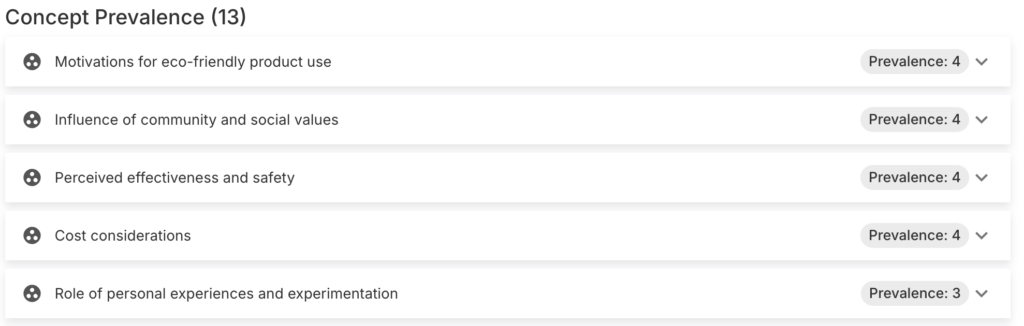
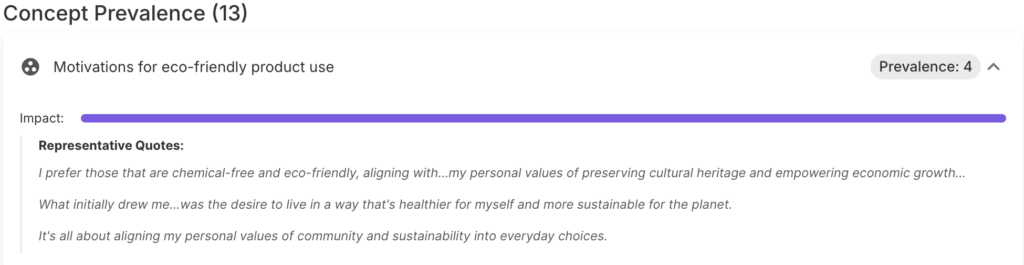
This lens analysis also includes a breakdown of unique concepts with prevalence scores and representative quotes to highlight theme strength.
Instead of manually scanning for data gaps or conceptual redundancy, researchers get an instant audit of dataset saturation, supported by:
- Impact bars and quote-level evidence for key concepts.
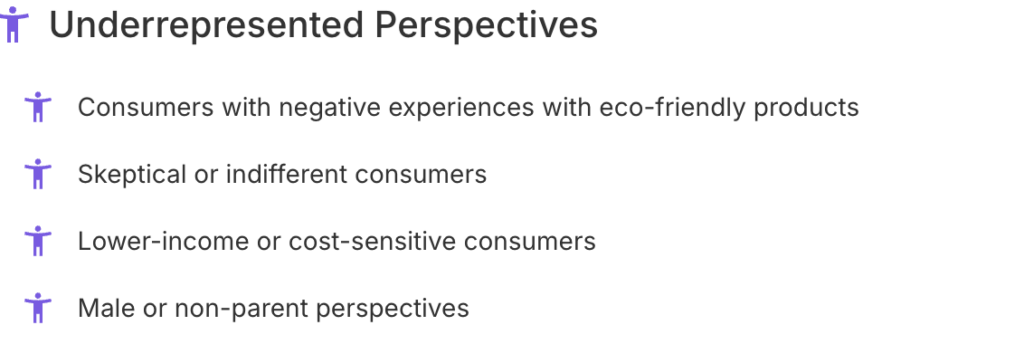
- A ranked list of demographic and conceptual blind spots.
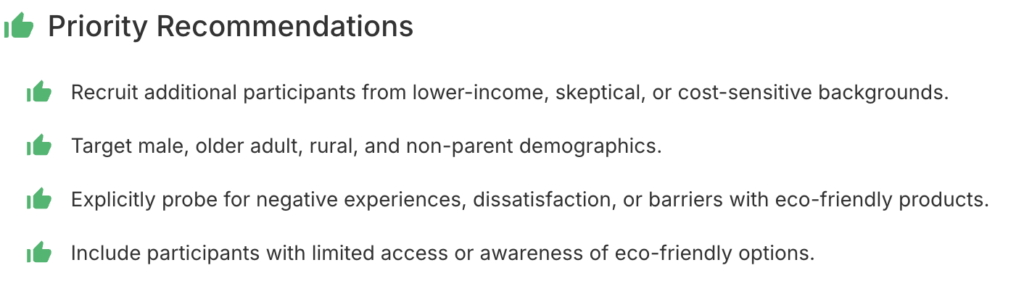
This lens also provides identification of underrepresented voices and missing perspectives essential for robust analysis. Further, it also provides actionable priority recommendations to strengthen data quality and coverage.
Want to know if your research sample is truly representative?
Run a Saturation & Coverage Gauge analysis now to uncover gaps, redundancies, and missing perspectives. Schedule a demo now!


