The Workshop Problem
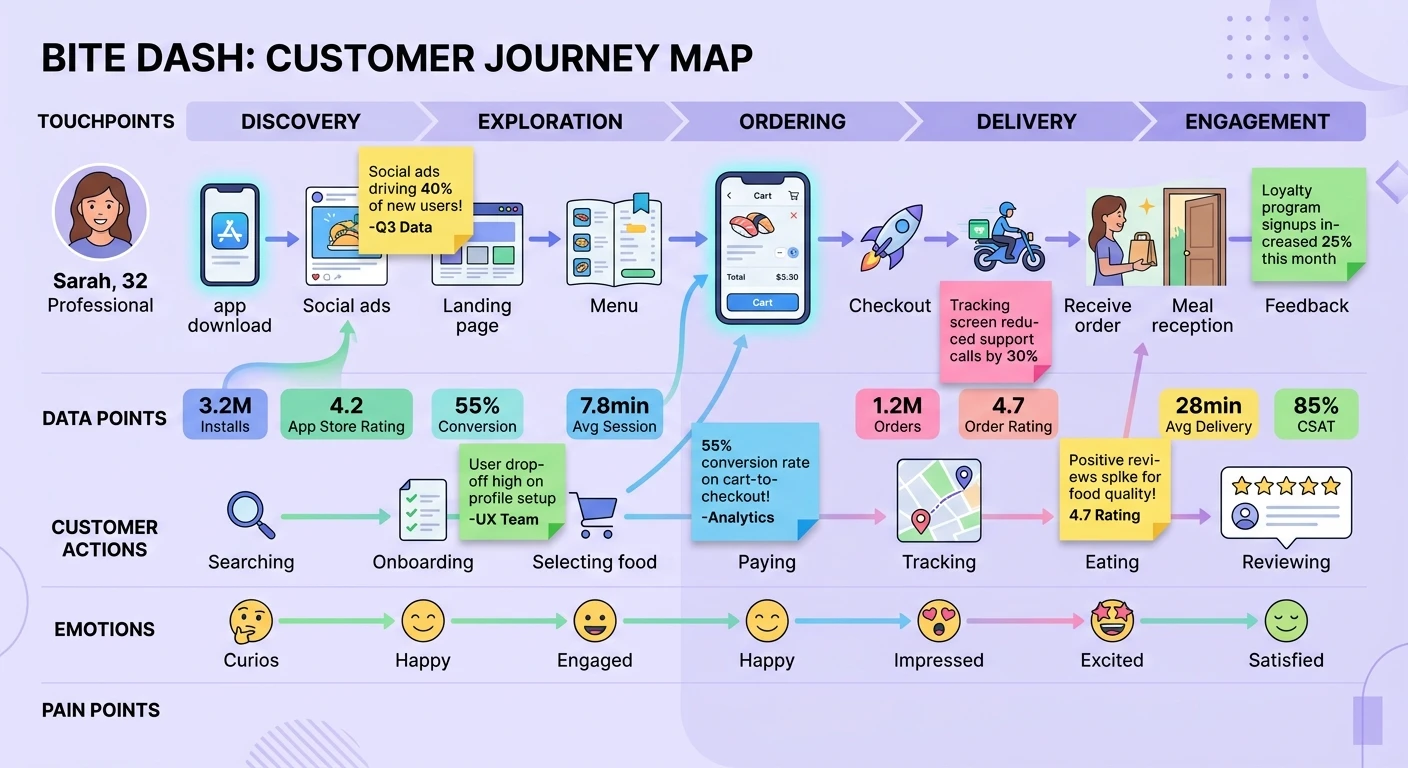
Every product team has a journey map somewhere. It was probably created in a two-hour workshop where cross-functional stakeholders arranged sticky notes on a whiteboard, argued about what customers "probably" feel at each stage, and left feeling aligned. The map was digitized, shared in Confluence, and never updated.
This is the journey map that lies.
It reflects internal mental models, not external reality. The stages are neat because internal processes are neat. The emotions are guessed because nobody asked. The pain points are the ones the team already knew about because uncomfortable surprises were not invited to the workshop.
The gap between workshop-generated journey maps and data-grounded journey maps is not incremental. It is the difference between a tourist map and a topographic survey. One helps you feel oriented. The other reveals the actual terrain -- the elevation changes, the hidden ravines, the paths that exist only because people carved them through underbrush.
What a Data-Grounded Journey Map Actually Requires
A journey map grounded in real data starts with real conversations. Not five. Not ten as a token gesture. Enough conversations to see patterns stabilize -- typically fifteen to twenty-five for a single journey, depending on segment complexity.
The conversations themselves need structure that maps to journey stages without leading participants through a predetermined narrative. This is where most teams fail. They ask "Walk me through your experience from awareness to purchase" and get a story that mirrors the funnel they already believe in. The participant, being helpful, organizes their messy reality into the clean stages implied by the question.
Better approaches start with moments, not stages. "Tell me about the last time you tried to solve this problem" captures the actual starting point, which is almost never where your funnel diagram says it is. "What happened next?" follows the participant's sequence, not yours. "What were you trying to figure out at that point?" reveals jobs-to-be-done at each stage without imposing your framework.
The data collection strategy matters as much as the interview protocol. Teams that rely solely on retrospective interviews get retrospective distortions. As research on recall bias in user interviews has demonstrated, participants reconstruct experiences to create coherent narratives that smooth over the confusion, backtracking, and contradiction that characterize real journeys.
This is why the strongest data-grounded journey maps triangulate across methods. Interview data provides the narrative structure and emotional texture. Behavioral analytics provide the actual sequence and timing. Support tickets and feedback channels provide the unfiltered friction points. The journey map synthesizes all three into something no single source could produce.
The Stages Are Wrong
The most common finding when teams ground their journey maps in real data is that the stages are wrong. Not slightly wrong. Structurally wrong.
Internal journey maps typically follow acquisition funnels: awareness, consideration, evaluation, purchase, onboarding, adoption, renewal. Clean, linear, and almost entirely divorced from how customers actually experience the product.
Real journeys are recursive. Customers loop back. They re-evaluate after onboarding. They discover features months into usage that change their mental model of what the product is for. They churn not at renewal but at the moment six months earlier when they failed to get a colleague to adopt the tool and quietly gave up on organizational change.
Real journeys have stages that do not appear in any funnel model. The "convincing my manager" stage. The "figuring out if this replaces or supplements our existing tool" stage. The "teaching myself because the onboarding assumed a different use case" stage. These stages are invisible to internal teams because they happen outside the product, but they are often where the journey succeeds or fails.
When research democratization empowers product teams to conduct their own journey research, these hidden stages surface faster because the people closest to the product hear directly how customers experience it -- and the gap between assumption and reality becomes impossible to ignore.
Emotions Are Not Guesses
Workshop journey maps include an emotion curve -- a wavy line that goes up at moments the team thinks customers are happy and down at moments the team thinks they are frustrated. This curve is fiction. It represents the team's projection of customer emotion, not customer emotion itself.
Data-grounded emotion mapping requires explicit attention during research conversations. Not "How did you feel?" -- which produces post-hoc rationalizations -- but attention to the language participants use in the moment of description. Hedging language, repetition, changes in speaking pace, unsolicited complaints, and spontaneous comparisons to competitors are all signals that map to emotional states more reliably than direct self-report.
Sentiment analysis applied to qualitative research can scale this process. When you have twenty-five interview transcripts, manually coding emotional valence at each journey stage is prohibitive. AI-assisted sentiment analysis identifies the emotional peaks and valleys across your data set, revealing patterns that no single researcher could hold in working memory.
The result is an emotion curve that reflects what customers actually feel, not what stakeholders imagine they feel. The differences are frequently surprising. Teams consistently overestimate frustration during known friction points and underestimate it during stages they thought were smooth. The reverse is also common: moments the team considers painful are sometimes experienced by customers as satisfying challenges.
Touchpoints Are Not Channels
Another fiction embedded in most journey maps: touchpoints are defined as channels. "Visits website." "Opens email." "Talks to sales." These are not touchpoints in any meaningful sense. They are interaction containers that reveal nothing about what the customer is trying to accomplish or how well the interaction served that goal.
A data-grounded touchpoint captures the job the customer is performing, the channel they are using to perform it, the information they need, the information they actually receive, and the gap between the two. "Visits website" becomes "Tries to understand pricing model but cannot find enterprise pricing, checks G2 reviews for pricing mentions, emails sales with a specific question about per-seat costs, waits three days for a response that does not answer the question."
This level of specificity only comes from qualitative data. Analytics can tell you that a prospect visited the pricing page and then left. Only interview data can tell you why they left and what they did next. This is the empathy gap in product analytics -- numbers reveal what happened but not the human experience behind it.
Building the Map From Data
The practical process of building a data-grounded journey map follows a specific sequence that differs from the workshop approach.
First, conduct the research. Fifteen to twenty-five interviews across the journey you are mapping, with participants recruited to represent your key segments. Use a protocol that follows participant narratives rather than imposing stages.
Second, code the transcripts for journey elements: actions, decisions, information needs, emotional signals, friction points, and workarounds. This is where AI-powered qualitative analysis transforms a weeks-long process into days. Automated thematic coding identifies recurring patterns across transcripts while preserving the specific language and context that make each data point actionable.
Third, synthesize the coded data into stages -- but let the stages emerge from the data rather than mapping data onto predetermined stages. If fourteen of twenty participants describe a "convincing colleagues" phase that does not appear in your existing funnel, that is a real stage. If your "onboarding" stage actually splits into three distinct phases with different emotional signatures, honor that complexity.
Fourth, layer in quantitative data. Behavioral analytics, support ticket volumes, NPS scores by journey stage, time-between-stages analysis. The qualitative data provides the structure and meaning. The quantitative data provides the scale and distribution.
Fifth, validate the map with participants. Share the synthesized journey with a subset of interview participants and ask where it matches their experience and where it diverges. This validation step catches the biases that even careful researchers introduce during synthesis.
Keeping Maps Alive
The final failure mode of journey maps is that they are treated as deliverables rather than living documents. A journey map created in Q1 reflects Q1 reality. By Q3, the product has changed, the competitive landscape has shifted, and customer expectations have evolved.
Data-grounded journey maps require continuous input. Not a full research project every quarter, but a steady stream of qualitative data that updates the map incrementally. This is where continuous discovery practices prove their value -- weekly customer conversations provide the ongoing data that keeps journey maps current.
The most effective teams treat their journey map as a dashboard, not a document. It is reviewed monthly, updated when new data contradicts existing assumptions, and used as the primary artifact for cross-functional alignment on customer experience priorities.
The Payoff
Teams that ground their journey maps in real data make different decisions. They prioritize differently because they see the stages that matter to customers rather than the stages that matter to internal processes. They allocate resources to the moments that actually determine success or failure rather than the moments that are most visible internally.
The journey map stops being a poster on the wall and starts being the operating system for customer experience decisions. That transition from fiction to data is not a nice-to-have. For any team serious about understanding their customers, it is the starting point.