The Measurement Problem in Research Operations
Every ResearchOps leader faces the same existential threat at budget time: "What has research actually delivered this quarter?" If your answer is "we completed 14 studies and conducted 87 interviews," you have already lost. Output metrics tell stakeholders you were busy. They say nothing about whether that busyness created value.
The research teams that survive budget cuts -- and get expanded headcount -- measure something fundamentally different. They track influence. They can point to specific product decisions that changed direction because of research findings. They can show that time-from-question-to-answer dropped from six weeks to four days. They can demonstrate that a single study's insights were reused across seven different product teams.
This is not about vanity dashboards. It is about building the evidence base that research is infrastructure, not overhead.
The Four Metrics That Actually Matter
1. Decision Influence Rate
This is the percentage of research studies that demonstrably influenced a product, design, or strategy decision. Not "informed" -- influenced. The distinction matters. A report that sits in Confluence informed nobody. A finding that changed a roadmap priority influenced a decision.
Tracking this requires a lightweight feedback loop: after every study, you follow up with the requesting stakeholder 2-4 weeks later. Did the findings change anything? What decision would have been made without this research? The target is not 100% -- some exploratory research has delayed impact. But if fewer than 60% of your studies influence decisions within a quarter, your research program has an alignment problem, not a quality problem.
As we explored in our analysis of how to present research findings that change decisions, the format of delivery matters as much as the quality of insight. Metrics without a delivery mechanism are just numbers.
2. Time-to-Insight
How long does it take from "we have a question" to "here is a defensible answer"? This is the operational efficiency metric that executives understand intuitively. In most organizations, the answer is depressingly long -- four to eight weeks for a standard qualitative study, including recruitment, fieldwork, analysis, and synthesis.
The teams compressing this to days rather than weeks are leveraging AI-powered analysis tools that handle transcription, initial coding, and pattern detection automatically. They are not replacing researcher judgment -- they are eliminating the mechanical work that sits between data collection and interpretation.
Track this metric by study type. Evaluative studies should be fastest (days). Exploratory studies will take longer (1-2 weeks). Strategic research programs are inherently longer. The goal is not uniform speed but predictable timelines that product teams can plan around.
3. Research Reuse Rate
The most expensive research is research that only gets used once. If a study about onboarding friction only informs the onboarding team, you have captured 10% of its potential value. The same findings likely matter to marketing (messaging), sales (objection handling), customer success (early churn signals), and the platform team (API developer experience).
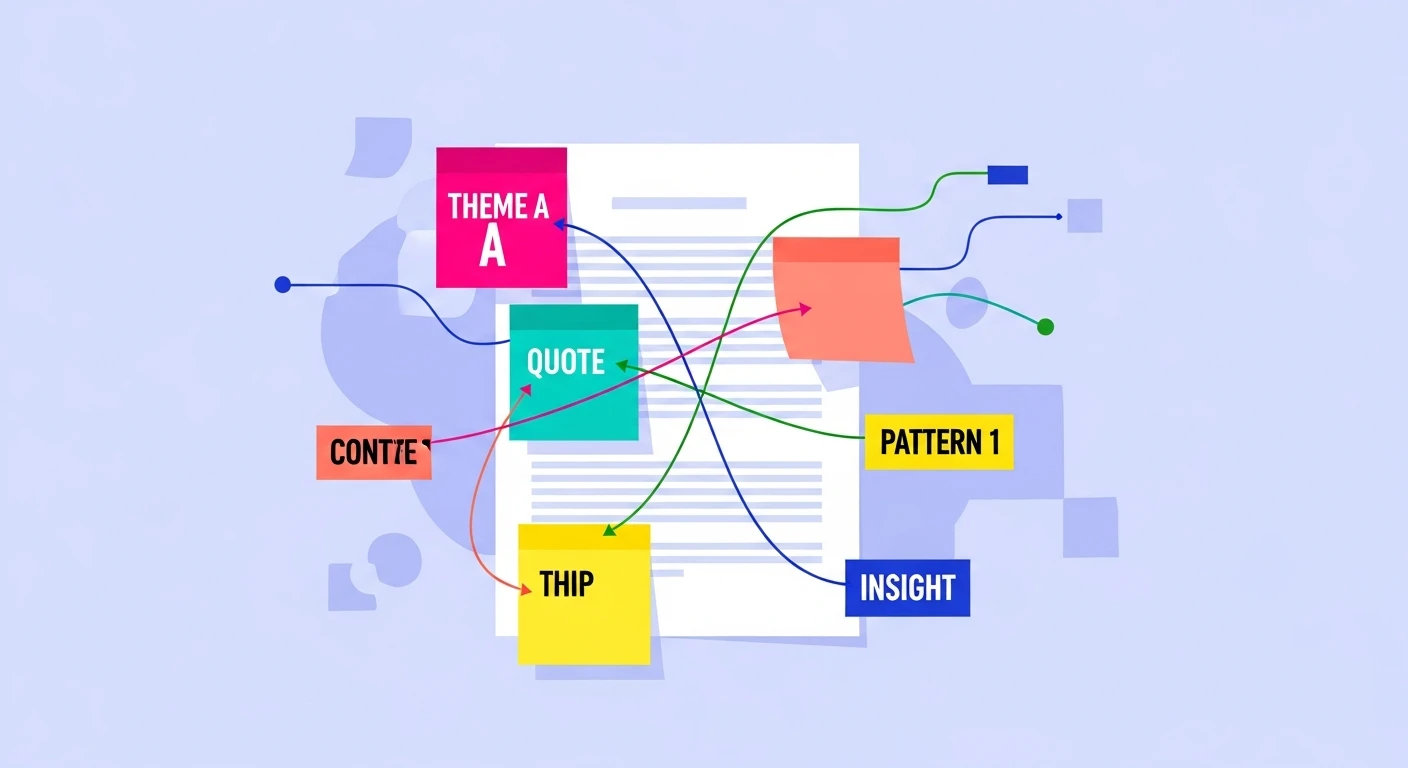
Research reuse rate measures how many teams or decisions a single study informs over its useful life. Building a research repository that teams actually use is the operational prerequisite. But measurement requires tagging: when someone pulls an insight from a past study into a new decision, that event needs to be recorded.
High-performing research operations achieve 3-4x reuse on average. Their insights have half-lives of 12-18 months rather than the typical "forgotten after the readout meeting" pattern.
4. Coverage-to-Demand Ratio
How much of the research demand from your organization can your team actually serve? This metric makes the resourcing conversation concrete. If product teams are requesting 40 studies per quarter and you can deliver 15, you have a 37% coverage rate. That means 63% of product decisions are being made without research input -- or teams are doing their own research without oversight.
This connects directly to the research democratization conversation. The answer is not always "hire more researchers." Sometimes it is building self-serve tools, templates, and training that let product teams handle evaluative research independently while your team focuses on strategic work.
Building Your Measurement Infrastructure
None of these metrics are available out-of-the-box. You need intentional infrastructure:
Decision tracking: A lightweight system (even a spreadsheet) where you log every study, the requesting stakeholder, the key findings, and -- critically -- follow up on what happened next. Did the decision change? Was the research cited in the PRD or strategy doc?
Time logging: Track the calendar days from intake to delivery for every study. Break it into phases: scoping, recruitment, fieldwork, analysis, synthesis, delivery. This reveals bottlenecks -- and most teams discover that recruitment and analysis are where time disappears.
Repository analytics: If your research repository has search and access logs, use them. Which studies get revisited? Which findings get cited in new contexts? If you do not have a repository, this metric alone justifies building one.
Demand capture: Every research request -- served or not -- should be logged. The backlog is not a failure; it is your evidence for investment. The principles behind enterprise AI governance apply equally to research operations: you cannot optimize what you do not measure, and you cannot fund what you cannot demonstrate value for.
Presenting Metrics to Leadership
The dashboard is not the deliverable -- the narrative is. Research leaders who successfully expand their programs frame metrics as a story about organizational risk and opportunity:
"Last quarter, research influenced 73% of major product decisions. Our time-to-insight dropped from 22 days to 9 days. But we could only serve 40% of demand. The 60% of decisions made without research input represent unquantified risk -- and based on the decisions we did influence, we estimate that unsupported decisions have a 3x higher rate of post-launch pivots."
That is a funding conversation. That is a headcount conversation. That is ResearchOps as strategic infrastructure.
The Anti-Metrics: What Not to Track
Avoid metrics that incentivize volume over value:
- Number of studies completed -- encourages small, low-impact work
- Number of interviews conducted -- rewards busywork over insight density
- Report page count -- longer is not better
- NPS of research team -- stakeholder satisfaction is lagging, not leading
These metrics make research look like a service desk. The four metrics above make research look like a strategic function. Choose accordingly.
Getting Started This Week
You do not need perfect tooling to start. This week:
- Audit your last 10 studies. For each one, can you identify a specific decision it influenced? If yes, you have your baseline decision influence rate.
- Pull timestamps from your last 5 projects. What was the average calendar time from request to delivery?
- Check whether any past study's findings have been referenced in a context beyond the original request.
- Count how many research requests you declined or deprioritized last quarter.
These four numbers are your starting point. They are probably uncomfortable. Good. Uncomfortable baselines drive investment conversations that comfortable vanity metrics never will.