Product teams love certainty. A dashboard shows a 15 percent drop in activation rates and the room moves to fix onboarding. A survey reports that 72 percent of users want dark mode and the feature gets prioritized. An interview with five enterprise buyers reveals confusion about pricing and the page gets redesigned.
Each of these decisions sounds reasonable in isolation. Each is also dangerously incomplete. The dashboard shows what happened but not why. The survey captures stated preferences but misses actual behavior. The interviews reveal depth from a tiny sample but cannot tell you whether the pattern holds at scale.
This is the problem with single-source research: it creates the illusion of knowing without the substance of understanding. And product teams pay for that illusion in shipped features that miss the mark, redesigns that solve the wrong problem, and roadmap bets that look smart on paper but fail in market.
Triangulation is the antidote. Not as an academic exercise in methodological rigor, but as a practical discipline that separates teams who build what customers need from teams who build what the data seemed to suggest.
What Triangulation Actually Means in Product Research
Triangulation is borrowed from navigation. If you know your distance from one landmark, you know you are somewhere on a circle. Two landmarks narrow it to two possible points. Three landmarks pin your exact location.
In research, triangulation means examining the same question through multiple independent methods. Not to check a box — to stress-test your confidence in what you think you know.
There are four types of triangulation that matter for product teams:
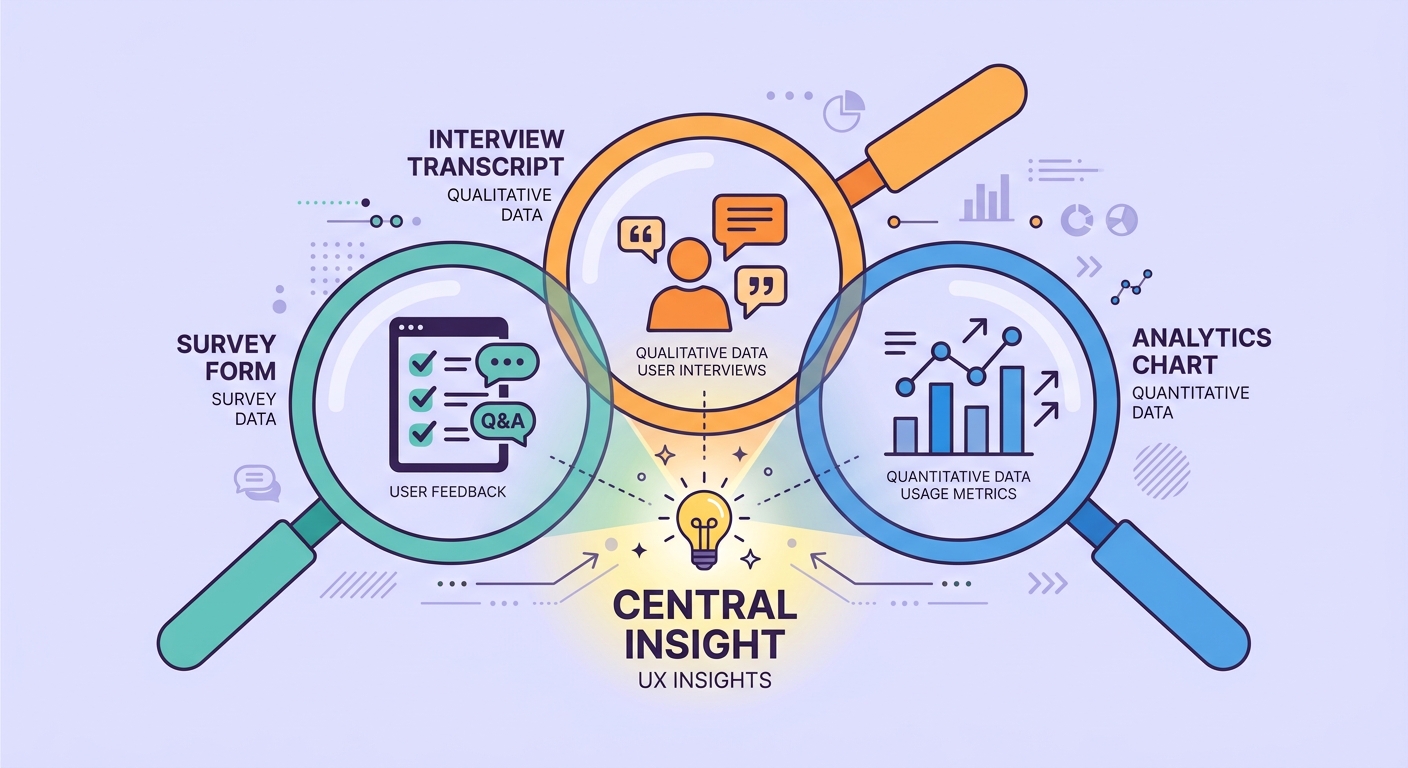
Method triangulation uses different research approaches to study the same question. You might combine user interviews with behavioral analytics and survey data. If all three converge on the same finding, your confidence is high. If they diverge, you have discovered something interesting — and potentially saved yourself from a bad bet.
Data triangulation examines the same question across different user segments, time periods, or contexts. A finding that holds across enterprise and SMB users, across geographies, and across seasons is more robust than one that appears only in a single cohort.
Investigator triangulation involves multiple researchers analyzing the same data independently. This counters the inevitable biases that any single analyst brings — the tendency to see what you expect to see, to weight confirming evidence more heavily, to overlook patterns that contradict your hypothesis.
Theory triangulation applies different conceptual frameworks to the same data. The same user behavior might look like a usability problem through one lens, a motivation problem through another, and a market positioning problem through a third. The framework that best explains the full pattern of evidence is likely closest to the truth.
Most product teams practice none of these deliberately. They run one study, draw conclusions, and move to execution. The speed feels efficient. The outcomes suggest otherwise.
The Single-Source Failure Modes
Each research method has characteristic blind spots. Understanding these is not academic — it is the practical reason triangulation matters.
Interviews Alone: Deep But Narrow
Qualitative interviews produce rich, nuanced understanding of individual experiences. They are irreplaceable for understanding the why behind behavior. But interviews have structural limitations that no amount of skilled moderation can fully overcome.
Sample sizes are small. Five to fifteen interviews might surface the major themes, but they cannot tell you how prevalent those themes are across your full user base. A problem that three of your eight interviewees described passionately might affect 2 percent of your users — or 60 percent. You simply do not know.
Participants also suffer from recall bias. They reconstruct their experiences through the lens of their current feelings and post-hoc rationalizations. The customer who tells you they churned because of a missing feature may have actually churned because a competitor offered a better price. They genuinely believe their own narrative, but the narrative is incomplete.
Surveys Alone: Broad But Shallow
Surveys reach scale. You can collect responses from thousands of users and slice the data across segments, behaviors, and demographics. The quantitative outputs feel precise and defensible.
But surveys measure what people say, not what they do. The gap between stated preference and actual behavior is one of the most well-documented phenomena in research. Users will tell you they want a feature and then never use it. They will report satisfaction on a survey and churn the following month. They will rate a workflow as "easy" and then require three support tickets to complete it.
Analyzing open-ended survey responses helps bridge this gap, but even the best verbatim analysis cannot replace direct observation of behavior.
Analytics Alone: Precise But Context-Free
Product analytics tells you exactly what happened. Click rates, conversion funnels, session durations, feature adoption curves. The data is behavioral, not self-reported, so it avoids the stated-preference problem.
But analytics cannot tell you why something happened. A drop in feature usage could mean the feature is broken, the feature is unnecessary, the feature is hard to find, or users found a better workaround. The same metric can have completely different root causes, and the correct response depends entirely on which cause is driving the pattern.
Analytics also only measures what you have instrumented. If you did not build the event, the behavior is invisible. And teams systematically over-instrument the behaviors they expect and under-instrument the behaviors that would surprise them.
Building a Triangulation Practice
Triangulation does not mean tripling your research workload. It means being intentional about combining methods that compensate for each other's weaknesses.
The Convergence Framework
For any important product decision, structure your evidence gathering around three questions:
What is happening? This is the domain of analytics. Identify the behavioral pattern — the drop, the spike, the funnel break, the cohort difference. Quantify it. Establish whether it is statistically meaningful and practically significant.
Why is it happening? This is the domain of qualitative research. Interview users who exhibit the behavior. Observe them in context. Understand the mental models, motivations, and friction points that analytics cannot reveal.
How widespread is it? This is the domain of surveys. Take the themes and hypotheses from your qualitative work and validate them at scale. Determine whether the patterns hold across your broader user base or are concentrated in specific segments.
The power of this framework is not just in the convergence — when all three sources agree. The real value is in the divergence. When your analytics show a behavior pattern, your interviews suggest one explanation, and your survey data contradicts that explanation, you have found a genuine insight. The divergence is the signal, not the noise.
Rapid Triangulation for Fast-Moving Teams
Triangulation does not require months of parallel research tracks. For teams shipping weekly, a rapid triangulation practice might look like this:
Week 1: Identify the question from analytics (what is happening?) and run 5 to 8 targeted interviews (why might it be happening?). Use AI-assisted interview analysis to synthesize findings in hours instead of days.
Week 2: Deploy a targeted survey informed by interview themes to validate prevalence. Compare survey results against the behavioral data.
Week 3: Synthesize all three sources. Document where they converge and where they diverge. Make the decision with explicit acknowledgment of remaining uncertainty.
This is not a three-month research program. It is a three-week discipline that dramatically improves decision quality. The teams that adopt this practice consistently report fewer post-launch surprises and less rework.
When to Skip Triangulation
Not every decision warrants multi-method evidence. Low-stakes, easily reversible decisions can often rely on a single source. If you are testing a button color or tweaking microcopy, an A/B test is probably sufficient.
The rule of thumb: triangulate when the cost of being wrong is high. Any decision that involves significant engineering investment, affects core user workflows, or would be expensive to reverse deserves the rigor of multiple evidence sources.
The Organizational Challenge
The biggest barrier to triangulation is not methodological — it is organizational. In most companies, analytics lives in the data team, surveys live in the CX team, and interviews live in the UX research team. Each group produces reports in their own format, on their own timeline, answering their own questions.
Breaking these silos requires structural changes. Research democratization helps by giving product teams direct access to multiple research methods. But democratization without triangulation discipline just means more single-source decisions made by more people.
The fix is to normalize multi-source evidence briefs. Before a major product decision, the evidence brief should explicitly address: what does the behavioral data show, what do users say about it, and how prevalent is the pattern? If any of these is missing, the brief is incomplete — and the decision is higher risk than it appears.
Platforms like Qualz.ai make triangulation practical by combining interview analysis with survey capabilities and integrating with analytics platforms. When your qualitative and quantitative data live in the same ecosystem, triangulation becomes a natural workflow rather than a cross-team coordination exercise.
The Competitive Advantage of Knowing More
Every product team operates with incomplete information. The question is not whether you have blind spots, but whether you know where they are.
Teams that practice triangulation do not make perfect decisions. They make decisions with explicit awareness of what they know, what they think they know, and what remains uncertain. That awareness is the competitive advantage.
In enterprise environments, where the cost of unanalyzed data already runs into the millions, adding triangulation discipline is not an extra cost — it is an insurance policy against the far larger cost of building the wrong thing.
The product teams that win in the long run are not the ones with the most data. They are the ones who bring the right combination of evidence to every significant decision. Triangulation is how you get there.
Single sources feel efficient. Multiple sources feel slow. But shipping the wrong feature and discovering the error six months later — that is the truly expensive path. And it is the path that single-source research reliably produces.