How to do the Saturation & Coverage Gauge Lens Analysis?
This guide walks you through running the Saturation & Coverage Gauge lens in Qualz.ai. The lens tells you whether you have heard enough diverse voices to be confident in your findings. It is ideal for researchers who need to assess conceptual saturation, identify underrepresented voices, and make sure a qualitative study has comprehensive coverage before drawing conclusions.
Step 1: Prepare Your Interview Transcripts
To run the Saturation & Coverage Gauge lens, you need interview transcripts in your Qualz.ai workspace. You can get them in two ways:
- Use AI-Moderated Interviews: If you conducted interviews with Qualz.ai's AI-Moderated Interview feature, transcripts are generated automatically. Make sure the sessions are marked as complete.
- Upload Existing Transcripts: For interviews conducted manually or transcribed elsewhere, upload the transcript files (DOCX, PDF, or TXT) by following the Upload Your Data guide.
Step 2: Open the Study and Go to "Run Analysis"
- Open the study that contains your transcripts.
- In the study's analysis dashboard, click the Run Analysis tab in the top menu.
- The Choose an Analysis Lens screen lists every available lens, grouped by purpose. You can filter lenses by name or tag.
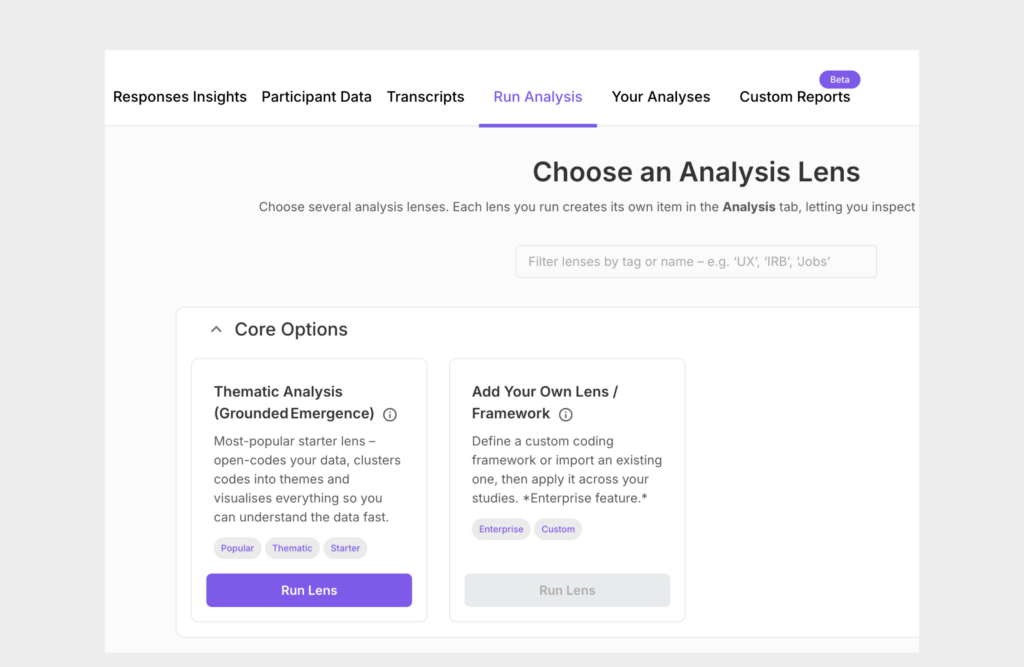
Step 3: Select the Saturation & Coverage Gauge Lens and Your Transcripts
Lenses are grouped into sections such as Core Options, Discover & Understand, Design & Build, Evaluate & Decide, and Quality & Trust. See What is Multi-Lens Analysis? for an overview of the lenses.
The Saturation & Coverage Gauge lens is in the Quality & Trust group, next to the Reflexivity & Bias Tracker.
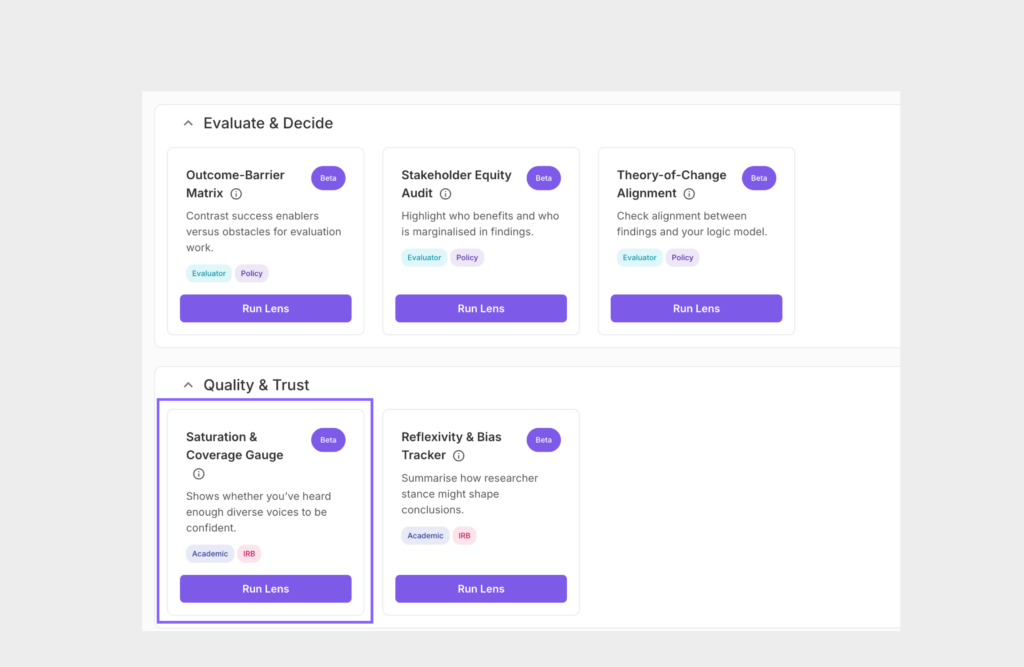
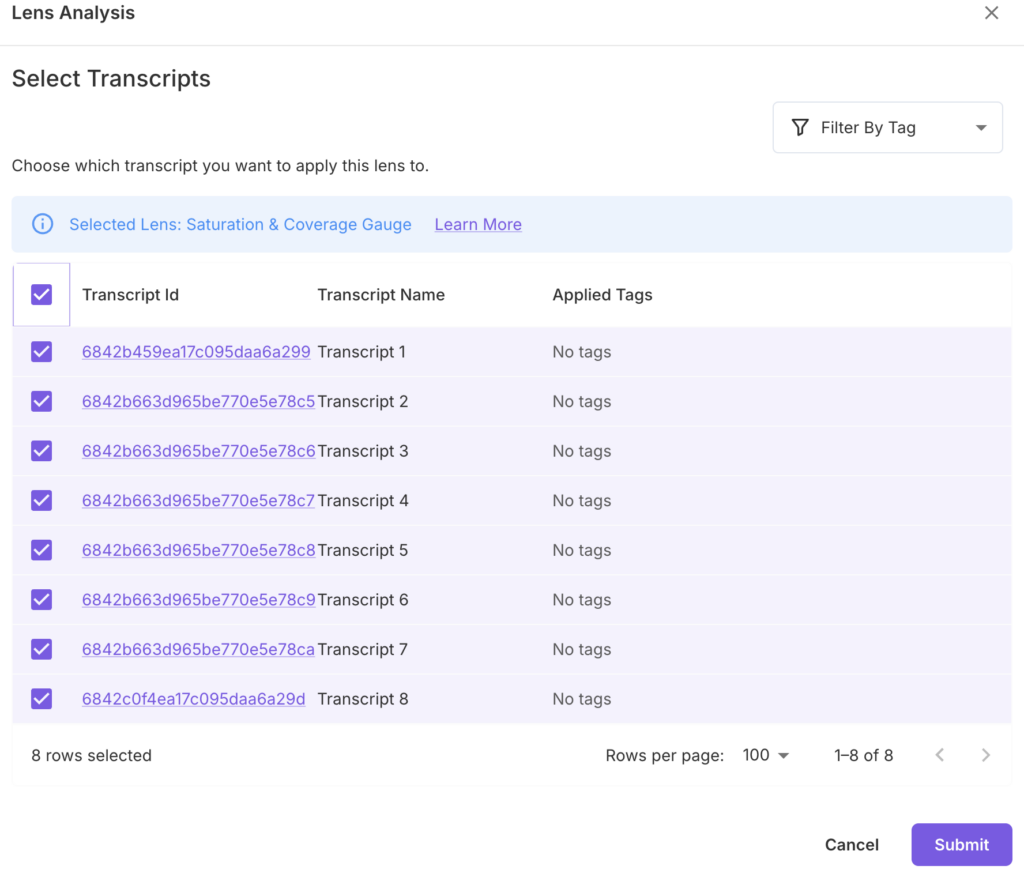
- Click Run Lens on the Saturation & Coverage Gauge card.
- In the Select Transcripts dialog, check the box next to each transcript you want to analyze. You can filter transcripts by tag.
- Click Submit to run the analysis.
Step 4: View the Results in "Your Analyses"
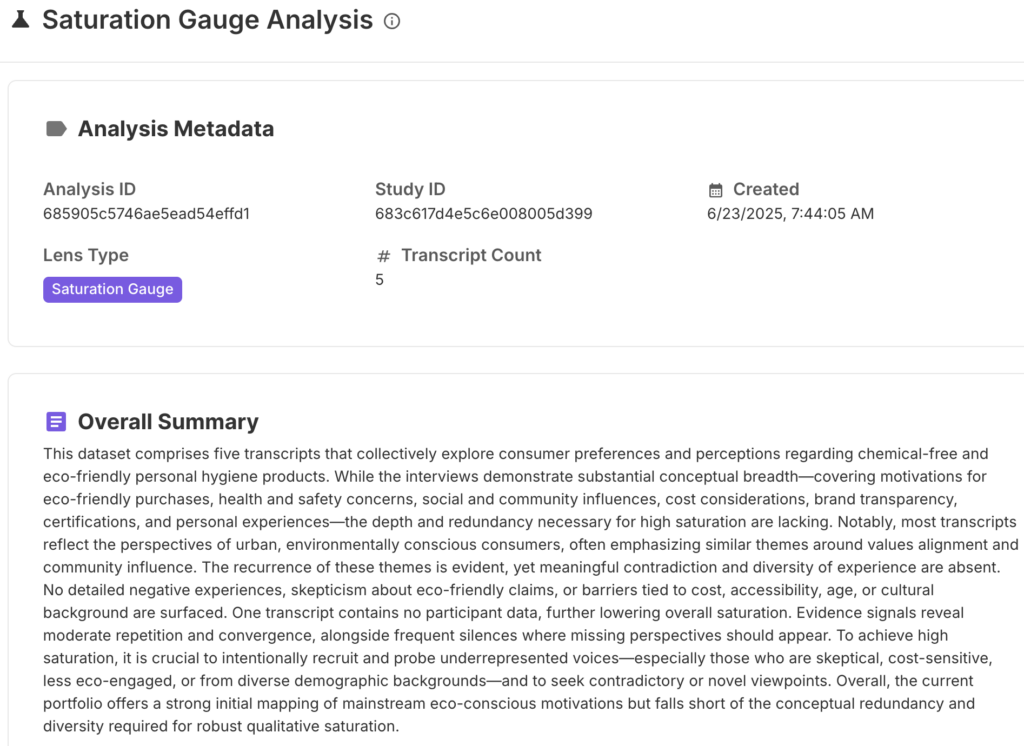
When the analysis finishes, open the Your Analyses tab to view it. The results page is titled Saturation Gauge Analysis and the lens type is shown as Saturation Gauge; this is the same lens. The analysis lets you evaluate the conceptual depth, diversity, and completeness of your dataset at a glance, through the sections below.
Analysis Metadata and Overall Summary
The top of the page shows the analysis ID, study ID, creation time, lens type, and the number of transcripts analyzed, followed by an Overall Summary. The summary describes how much conceptual breadth and redundancy the transcripts show, which perspectives recur, which are missing, and what it would take to reach saturation.
Saturation Level and Signal Distribution
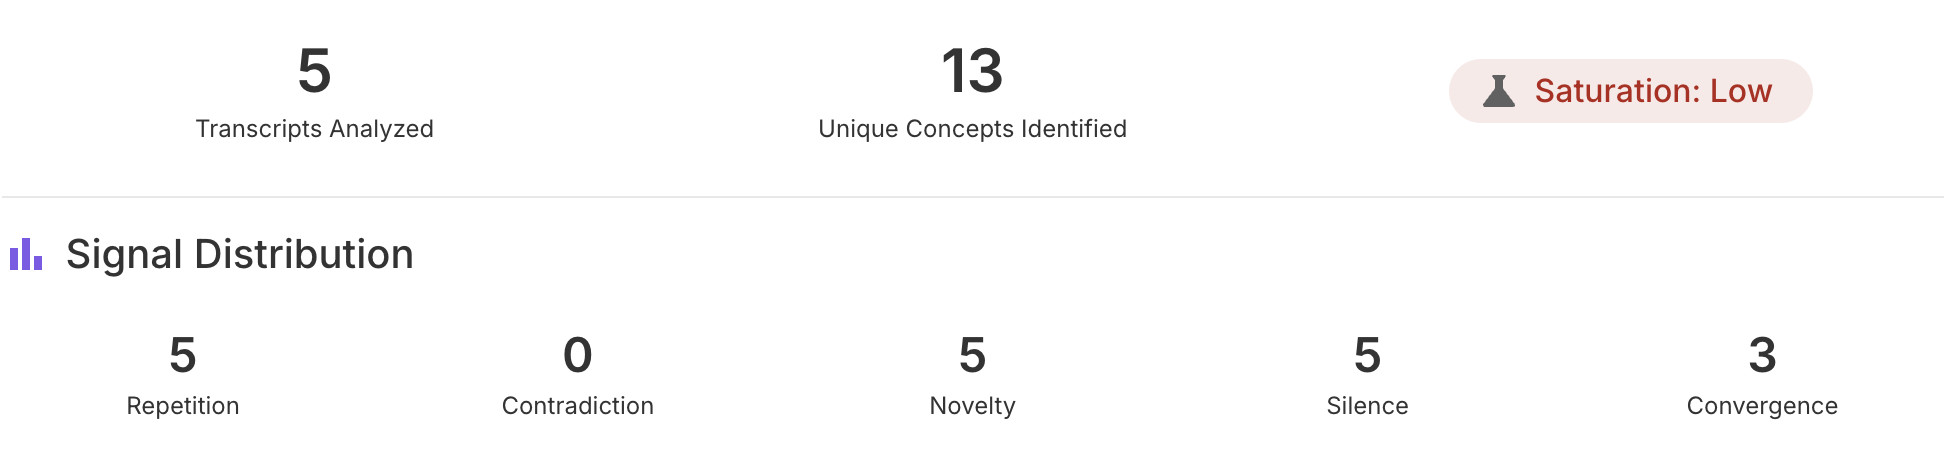
Below the summary you will see the number of Transcripts Analyzed, the number of Unique Concepts Identified, and an overall Saturation level (Low, Medium, or High) reflecting how thoroughly your data captures the topic.
The Signal Distribution panel shows how many of the evidence signals that feed the saturation level were detected across the transcripts:
- Repetition: the same concepts coming up again across transcripts.
- Contradiction: participants disagreeing with each other or reporting conflicting experiences.
- Novelty: new concepts still appearing in later transcripts.
- Silence: places where an expected perspective is missing from the data.
- Convergence: transcripts settling on the same themes.
High repetition and convergence with little novelty point towards saturation. Frequent silences and a lack of contradiction mean important voices are still missing.
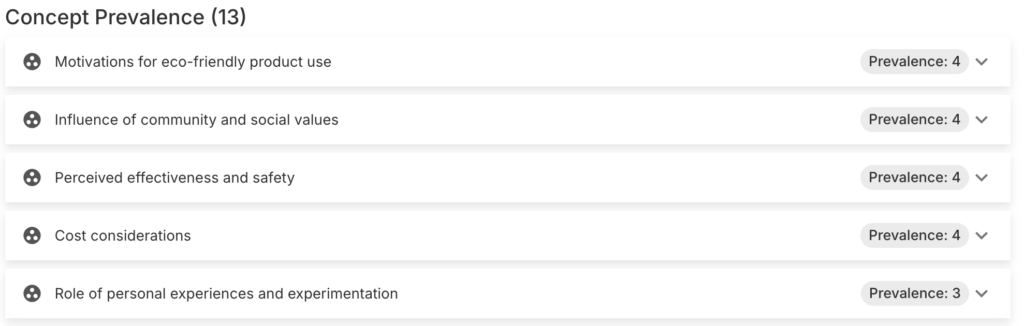
Concept Prevalence
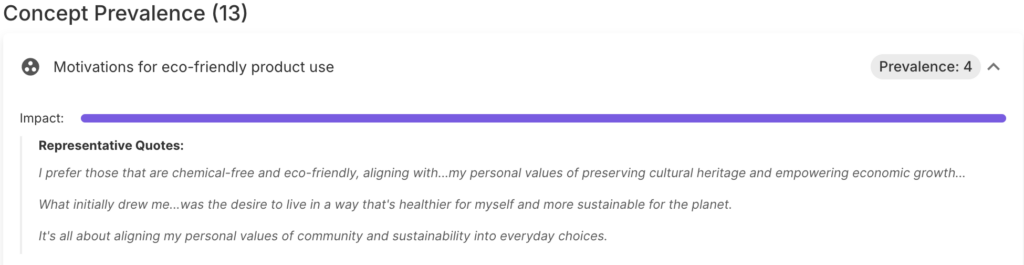
Every unique concept found in the data is listed with a prevalence count. Expand a concept to see an impact bar and representative quotes that show how strongly the concept is supported.
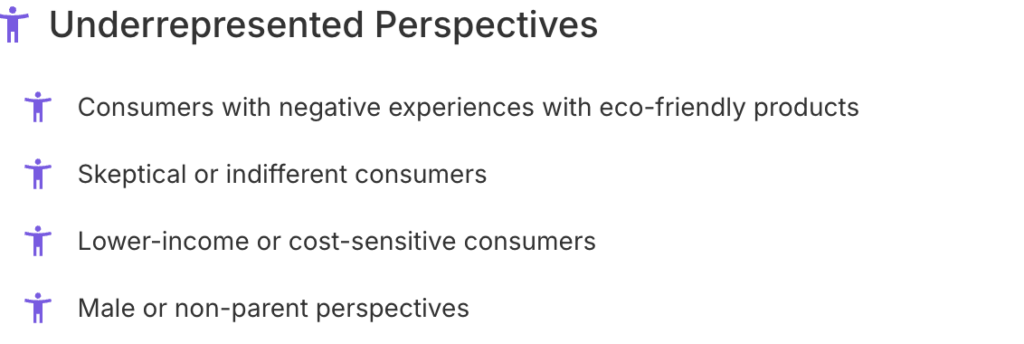
Underrepresented Perspectives
The lens lists the voices and perspectives that are missing or thin in your dataset, such as skeptical consumers or specific demographic groups, so you know where coverage is weakest.
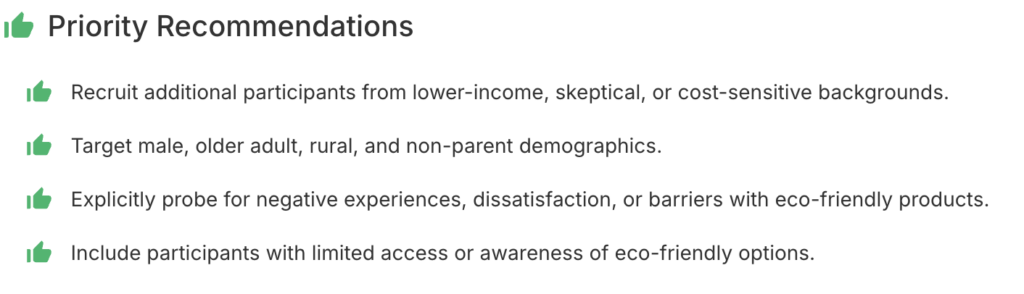
Priority Recommendations
Finally, the lens gives actionable recommendations for strengthening data quality and coverage, such as which groups to recruit next and which topics to probe explicitly.
Want to know if your research sample is truly representative? Run a Saturation & Coverage Gauge analysis to uncover gaps, redundancies, and missing perspectives. Schedule a demo now!