The Paradox of Faster Tools and Slower Insights
Every tool in your research stack promises speed. Your scheduling tool eliminates back-and-forth emails. Your transcription tool delivers text in minutes instead of days. Your analysis tool surfaces themes automatically. Your repository tool makes findings searchable instantly.
And yet: the time from research question to actionable insight has not meaningfully decreased for most teams. In many organizations, it has actually increased.
This is the tool sprawl paradox. Individual step optimization creates system-level degradation. Each tool boundary introduces a handoff — data export, format conversion, context loss, manual re-entry — that consumes the time savings the tool supposedly provides. Your 12-tool stack is locally optimal and globally dysfunctional.
The research operations community has been treating this as a workflow design problem: better processes, clearer handoff protocols, dedicated ResearchOps roles to manage the complexity. But the problem is architectural. You cannot process-engineer your way out of a fragmented technology stack any more than you can meeting-engineer your way out of organizational silos.
Anatomy of the Modern Research Stack
Here is what a typical enterprise research team's tool ecosystem looks like in 2026:
Layer 1: Recruitment and Scheduling
Panel management platform, screener builder, scheduling tool, incentive management system. Four tools before a single interview begins.
Layer 2: Data Collection
Video conferencing platform, note-taking tool, survey platform, diary study tool, unmoderated testing platform. Five more tools depending on methodology.
Layer 3: Processing
Transcription service, translation service, data anonymization tool. Three tools that sit between raw data and analysis.
Layer 4: Analysis
Qualitative coding tool, thematic analysis platform, sentiment analysis service, quantitative analysis tool. Multiple tools that may not share data.
Layer 5: Storage and Distribution
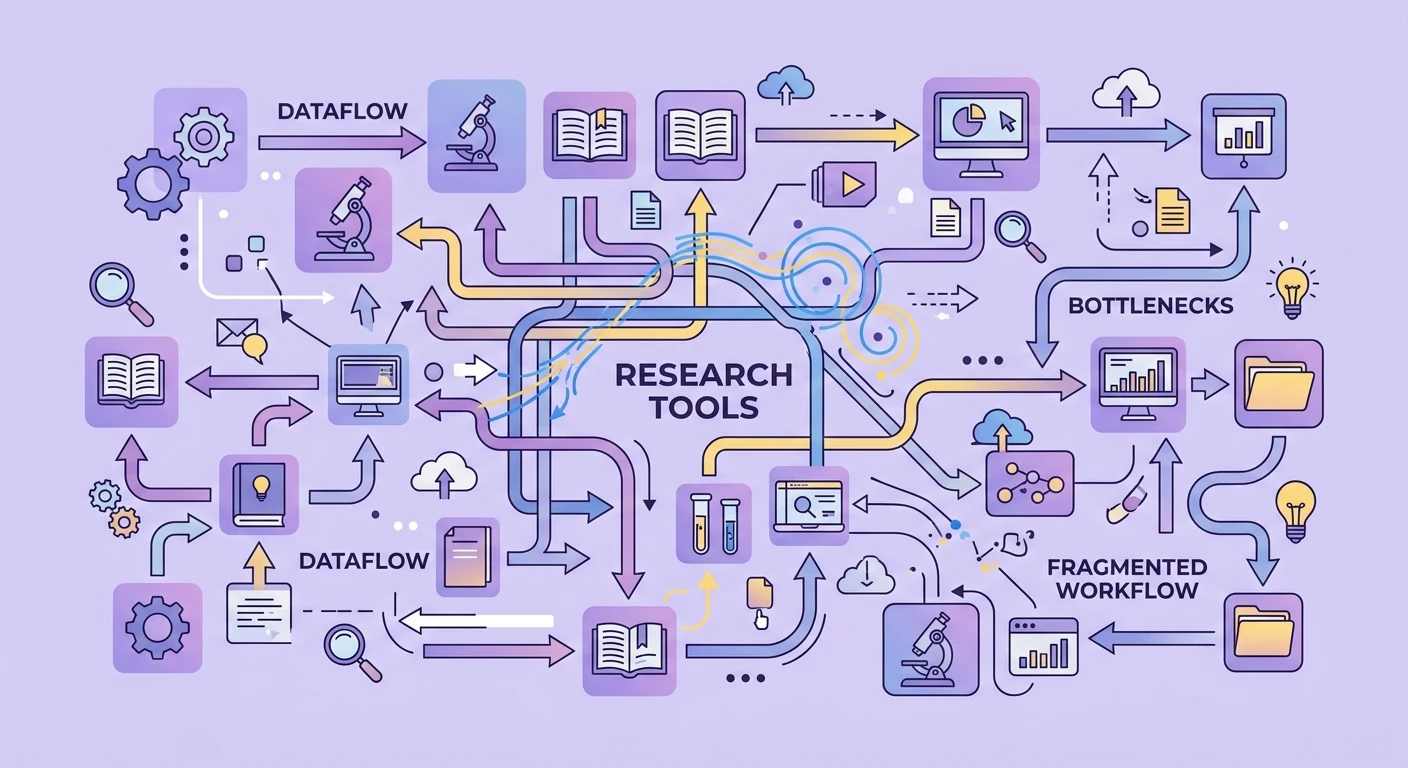
Research repository, insight management platform, presentation tool, stakeholder communication channel. The last mile before insights reach decision-makers.
Each layer has its own login, its own data model, its own export format, and its own idea of what a "project" means. Data flows between layers through manual effort, brittle integrations, or CSV exports that strip context. This is not a stack — it is an archipelago.
Where Time Actually Goes
When research teams audit their time allocation, the results are consistently surprising. The actual research activities — interviewing, observing, analyzing, synthesizing — consume less than 40% of total project time. The majority goes to:
Context recreation (20-25% of project time). Moving between tools means re-establishing context at each transition. When you export transcripts from your transcription tool to your analysis tool, you lose the participant metadata, the session notes, the emotional moments you flagged during the conversation. You must recreate this context manually or proceed without it — both options cost time or quality.
Format translation (10-15%). Each tool expects data in its preferred format. Screener responses need restructuring for your analysis tool. Coded data needs reformatting for your repository. Findings need redesigning for stakeholder presentations. You become a data janitor rather than a researcher.
Tool administration (10-15%). Managing accounts, permissions, integrations, updates, billing across a dozen platforms. This is pure overhead that scales with tool count, not research volume.
Synchronization and deduplication (5-10%). When the same information exists in multiple tools — participant details in your panel, your screener, your scheduling tool, and your repository — keeping them synchronized is ongoing work. When they drift out of sync (and they always drift), resolving discrepancies consumes more time.
This connects to the broader research synthesis debt problem. Tool fragmentation does not just slow individual projects — it makes cross-project synthesis nearly impossible because insights are scattered across incompatible systems.
The Hidden Quality Cost
Tool sprawl does not just slow research down. It actively degrades research quality in ways that are difficult to measure but profoundly impactful:
Context stripping. Every tool boundary strips analytical context. By the time a finding reaches your repository, it has been separated from the transcript excerpt that supports it, the participant who articulated it, the session dynamics that produced it, and the researcher's in-the-moment interpretive notes. What remains is a decontextualized claim — difficult to evaluate, impossible to trace back to evidence without significant archaeological effort.
Analytical fragmentation. When analysis happens across multiple tools, the researcher loses the ability to see the full picture simultaneously. You cannot notice a contradiction between what Participant 3 said in their diary entry (in tool A) and what they said in their interview (in tool B) if you are working in tool B and tool A's data is not visible. The detection of contradictions requires holistic data access that fragmented stacks cannot provide.
Institutional memory loss. When a researcher leaves, their knowledge of how the tool stack fits together — which workarounds are necessary, which integrations are reliable, which export formats preserve what data — leaves with them. The next researcher inherits the tools but not the operational knowledge that made them function as a system.
The Integration Illusion
The market response to tool sprawl has been integration: Zapier connections, API bridges, middleware platforms that promise to connect your fragmented stack into a unified workflow. This addresses symptoms without touching root causes.
Integrations are:
- Brittle. They break when either tool updates its API, creating silent data loss that may go undetected for weeks.
- Lossy. They transfer data fields but not context, relationships, or analytical state.
- Maintenance-intensive. Each integration is a custom connection that someone must monitor, troubleshoot, and update.
- Partial. Most integrations cover the happy path. Edge cases, error handling, and complex data structures fall through.
The enterprise software industry learned this lesson a decade ago with ERP systems: point-to-point integrations between best-of-breed tools create exponential complexity. The solution was platform consolidation — accepting slightly worse individual features in exchange for dramatically better system coherence. Research tooling is arriving at the same inflection point.
What a Consolidated Stack Looks Like
The emerging alternative to tool sprawl is the research platform — a single system that handles the complete workflow from participant recruitment through insight distribution. This is not about feature bloat or doing everything poorly. It is about architectural coherence: a single data model, continuous context, and zero-handoff analysis.
In a consolidated platform:
- Participant context flows from recruitment through to analysis without manual transfer
- Session recordings, transcripts, and notes exist as a unified object rather than scattered files
- Analysis operates on full context — the analyst can access original audio, participant background, and session notes while coding
- Findings link directly to supporting evidence without export/import cycles
- Repository search covers everything — raw data, analysis, and synthesized insights — in one query
This architectural coherence is what enables the research repository that teams actually use. A repository fed by lossy exports from fragmented tools will always be incomplete. A repository that is part of the research platform contains everything by default.
The Consolidation Decision Framework
Not every team should consolidate immediately. Here is how to evaluate whether your tool sprawl has reached the point where consolidation delivers net value:
Measure your handoff tax. Track time spent on data transfer, format conversion, and context recreation for three projects. If handoff activities consume more than 20% of total project time, your stack fragmentation is costing more than any individual tool saves.
Count your context losses. In your last research readout, how many times did someone ask a question you could not answer because the relevant data was in a different tool? Each unanswered question represents a context loss with potential decision impact.
Assess your cross-project capability. Can you easily find all research related to a specific feature, user segment, or research question across the past year? If this requires searching multiple tools with different query languages, your institutional research memory is fragmented.
Calculate your administration overhead. Sum the hours spent on tool management — billing, permissions, updates, integration monitoring, troubleshooting — across your entire stack. This is the tax you pay for architectural fragmentation.
If these metrics reveal significant costs, the case for consolidation is strong regardless of how good your individual tools are at their narrow functions.
Migration Without Disruption
The practical barrier to consolidation: you cannot stop researching while you migrate. Teams need a transition strategy that maintains research continuity while reducing tool count.
Phase 1: New projects on the consolidated platform. Start all new research projects on your chosen platform. Existing projects continue in the old stack until completion.
Phase 2: Historical data migration. Migrate completed project data into the new platform's repository. Prioritize recent and frequently-referenced projects. Accept that some historical data may remain in legacy tools as read-only archives.
Phase 3: Legacy tool sunset. Once all active projects use the new platform and critical historical data is migrated, decommission legacy tools. This typically takes 3-6 months for active research teams.
The key insight: you do not need to migrate everything to realize consolidation benefits. New projects on a unified platform immediately experience zero-handoff workflows. Historical migration is a nice-to-have for institutional memory, not a prerequisite for operational improvement.
The Organizational Implications
Tool consolidation changes more than technology. It changes roles, workflows, and organizational structures:
ResearchOps role evolution. When the stack was fragmented, ResearchOps focused heavily on tool management and workflow orchestration. In a consolidated environment, ResearchOps can focus on what actually matters: research quality standards, participant experience, and insight distribution strategy. The role becomes more strategic and less administrative.
Researcher autonomy. Fragmented stacks often require dedicated support for tool transitions — someone to handle exports, imports, and format conversions. Consolidated platforms enable researcher self-sufficiency across the full workflow, reducing dependencies and bottlenecks.
Insight velocity improvement. Teams consistently report 40-60% reduction in time-from-question-to-insight after consolidation. This is not because any single analytical step is faster — it is because the handoff overhead between steps disappears entirely.
As the broader research operations metrics discussion emphasizes, the metrics that matter are outcomes (insight velocity, decision influence, research utilization) rather than outputs (studies completed, interviews conducted). Tool consolidation improves outcomes even when output volume stays constant.
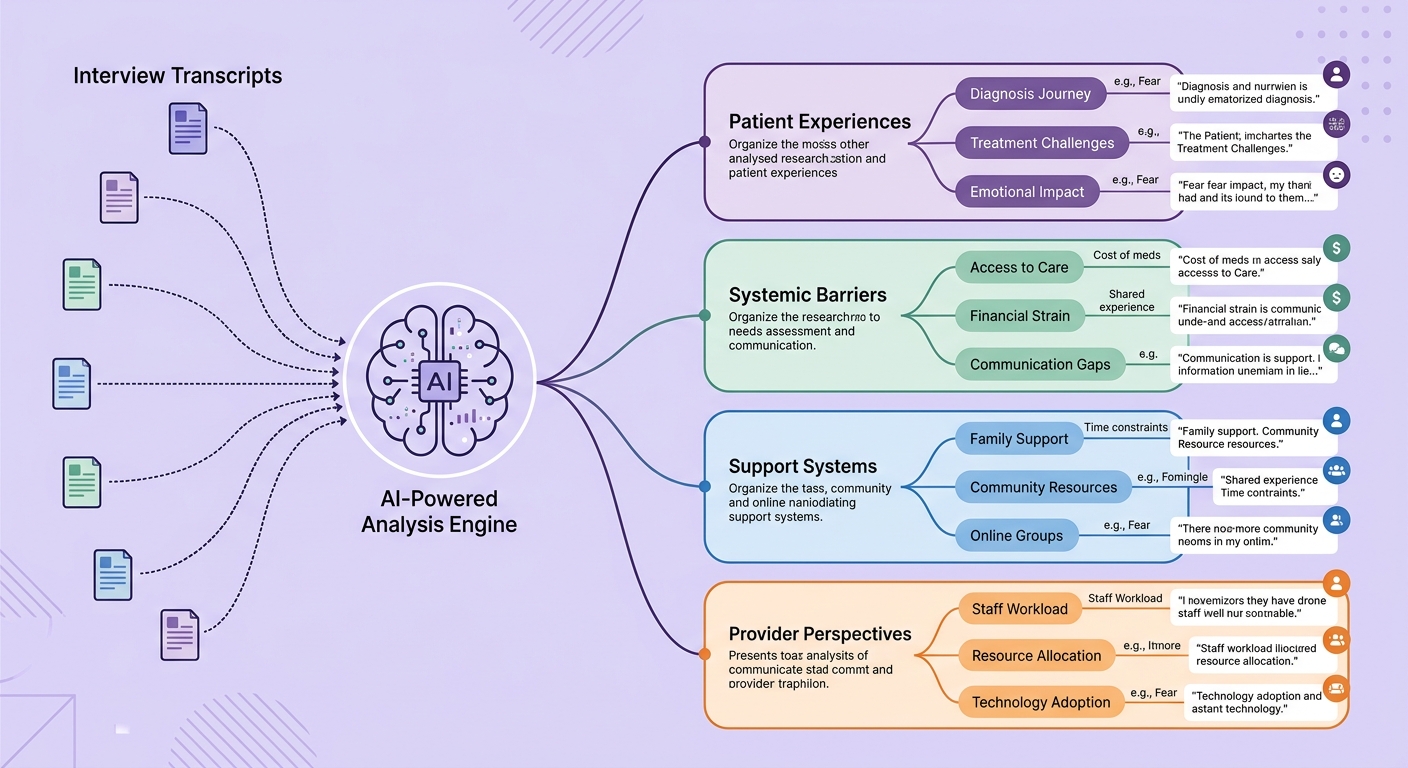
What Mature Research Operations Look Like in 2026
The research teams producing the highest-quality insights at the fastest velocity share common architectural patterns:
- Single platform for the core workflow — from participant engagement through insight synthesis
- AI embedded in the analytical layer — not bolted on through integration but native to the data model
- Continuous context — every analytical decision traceable to source data without tool hopping
- Stakeholder access built in — product managers and executives can explore findings without researcher mediation
- Cumulative knowledge — every project adds to an institutional research memory that compounds over time
This is not aspirational. Teams using platforms like Qualz.ai that integrate the full research workflow — from AI-adaptive interviews through automated analysis to searchable repositories — are already operating this way. The question is not whether the industry will consolidate but how quickly individual teams will make the transition.
The Cost Arithmetic
Teams resist consolidation partly because individual tools feel inexpensive. But the total cost of ownership for a fragmented stack is dramatically higher than it appears:
- 7-12 individual tool subscriptions
- Integration middleware costs
- ResearchOps time spent on tool management (often 0.5-1 FTE equivalent)
- Researcher time lost to handoffs (15-25% per researcher)
- Quality costs from context stripping (unmeasured but real)
- Opportunity cost of slower insight delivery
When calculated honestly, most enterprise research teams spend more on their fragmented stack (including hidden labor costs) than they would on a comprehensive platform. The fragmented approach just distributes costs across budget lines where they are individually invisible.
Ready to consolidate your research stack and eliminate handoff overhead? Book an information session to see how Qualz.ai replaces your fragmented toolchain with a unified research workflow.