Survey Reports
Once you collect your survey responses, either from human participants or AI participants, you can build your own reports in Qualz.ai. A custom report brings your charts and written findings together in one document you can download.
Create a Report
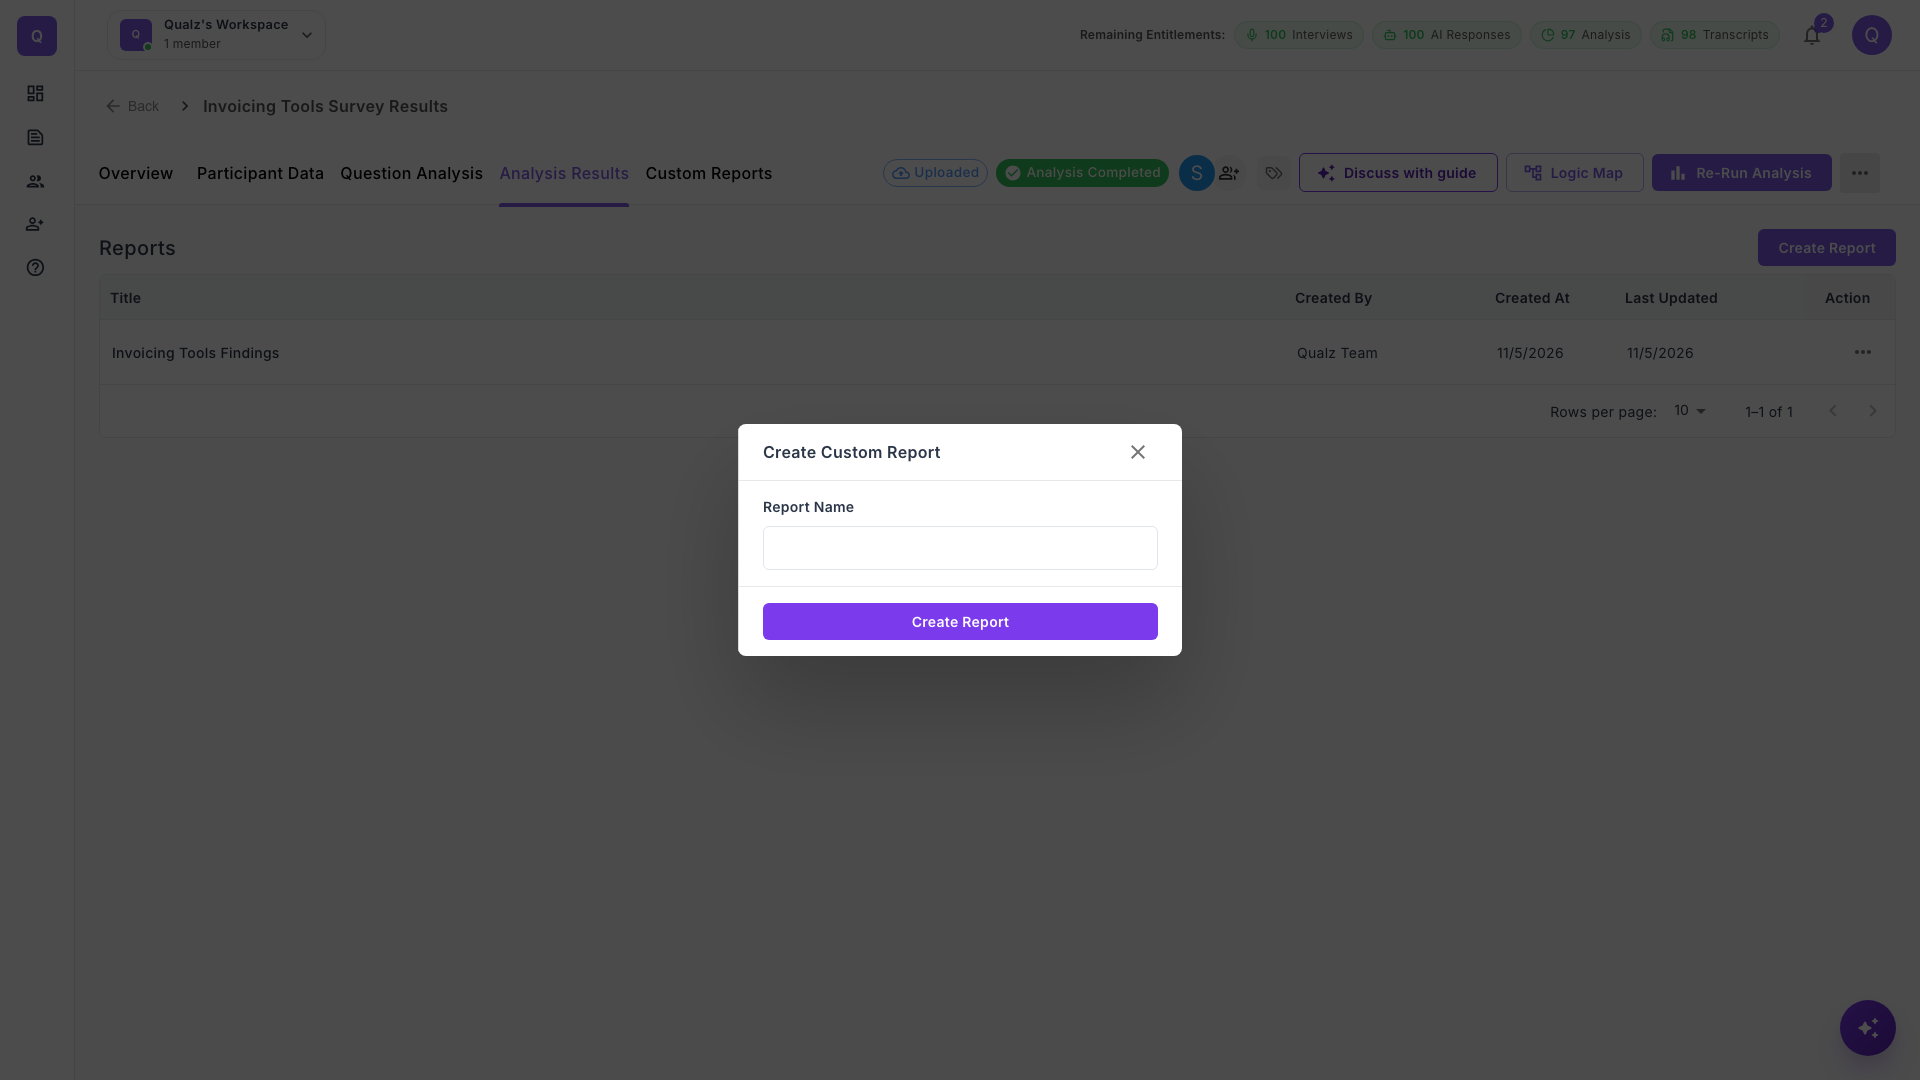
- Open your survey from the Surveys page.
- Click the Custom Reports tab.
- Click Create Report, enter a Report Name and click Create Report again.
Your report appears in the list. Click its name to open it.
Add Charts from Your Results
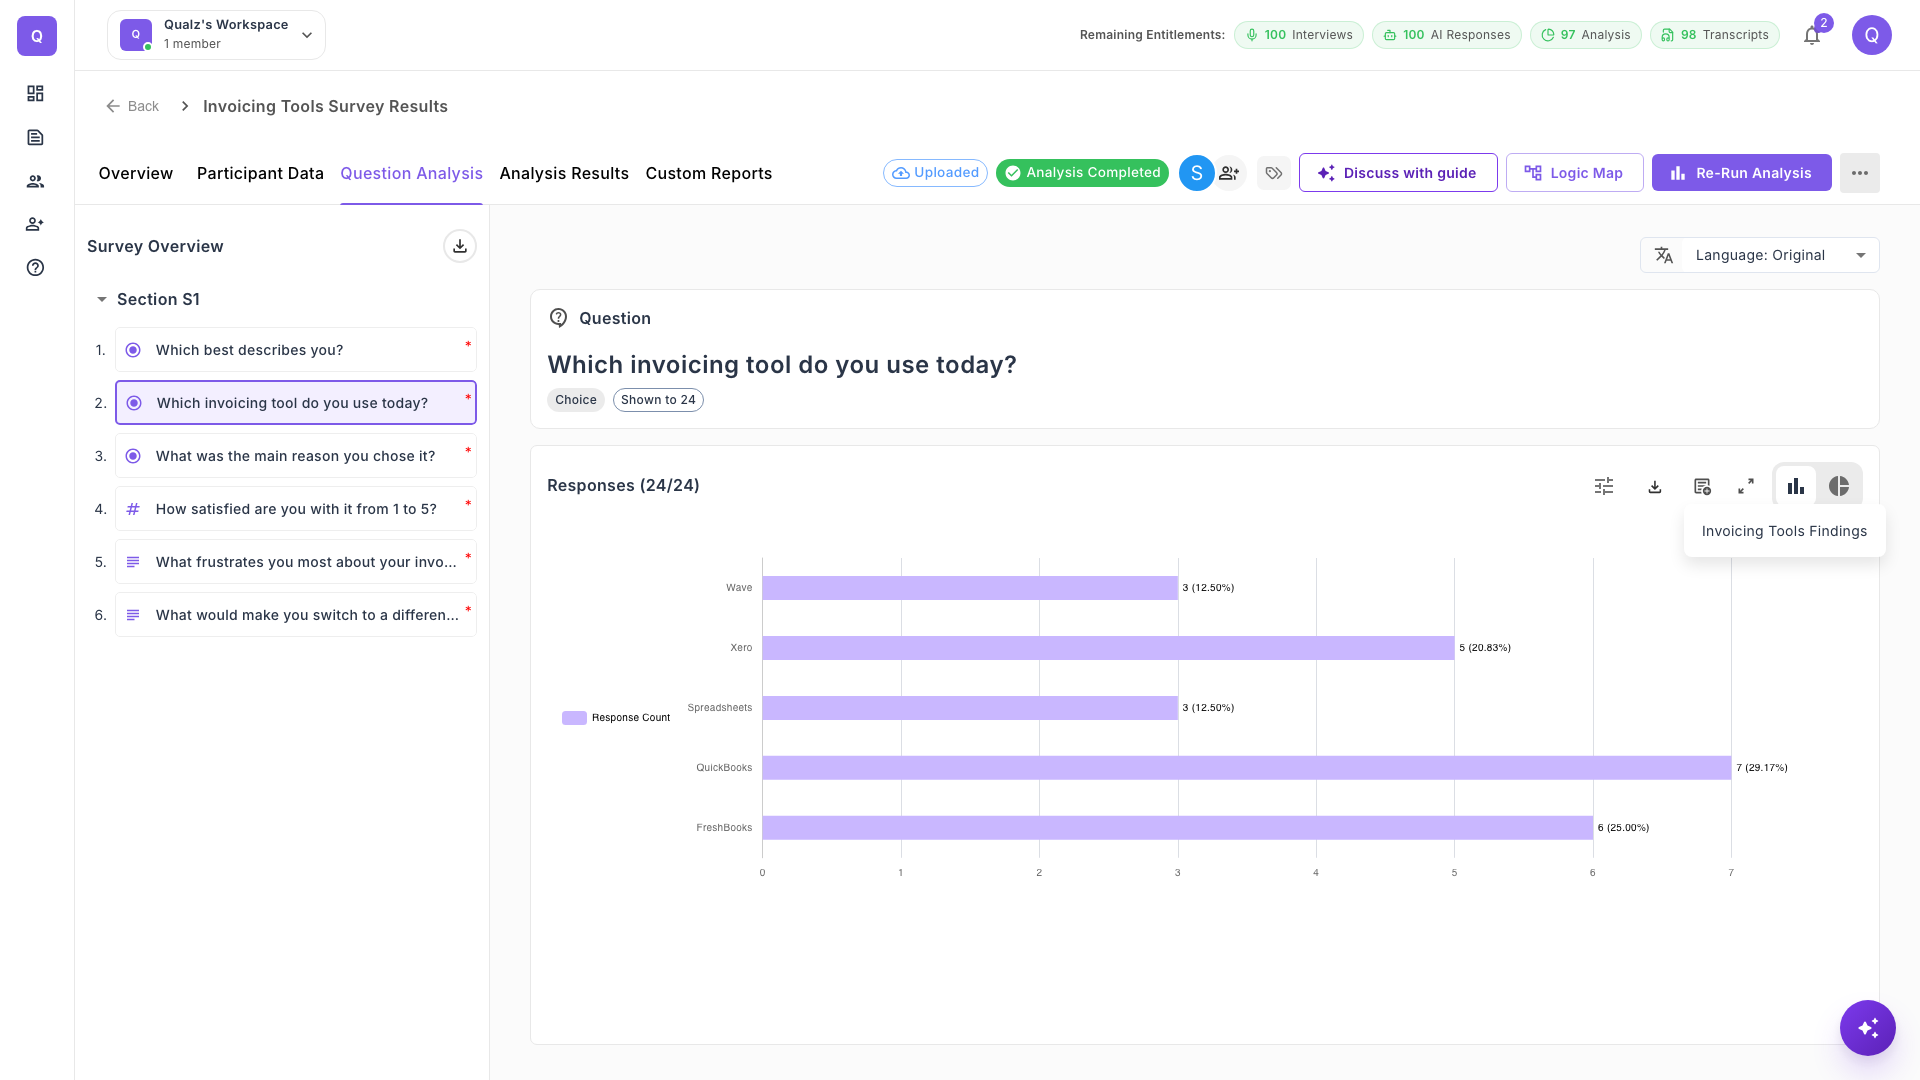
- Open the Question Analysis tab and select a question.
- On the chart, click the Add to custom report icon.
- Select the report you want to add it to.
Charts can also be added from the Overview tab. See How to Analyze a Survey.
Edit Your Report
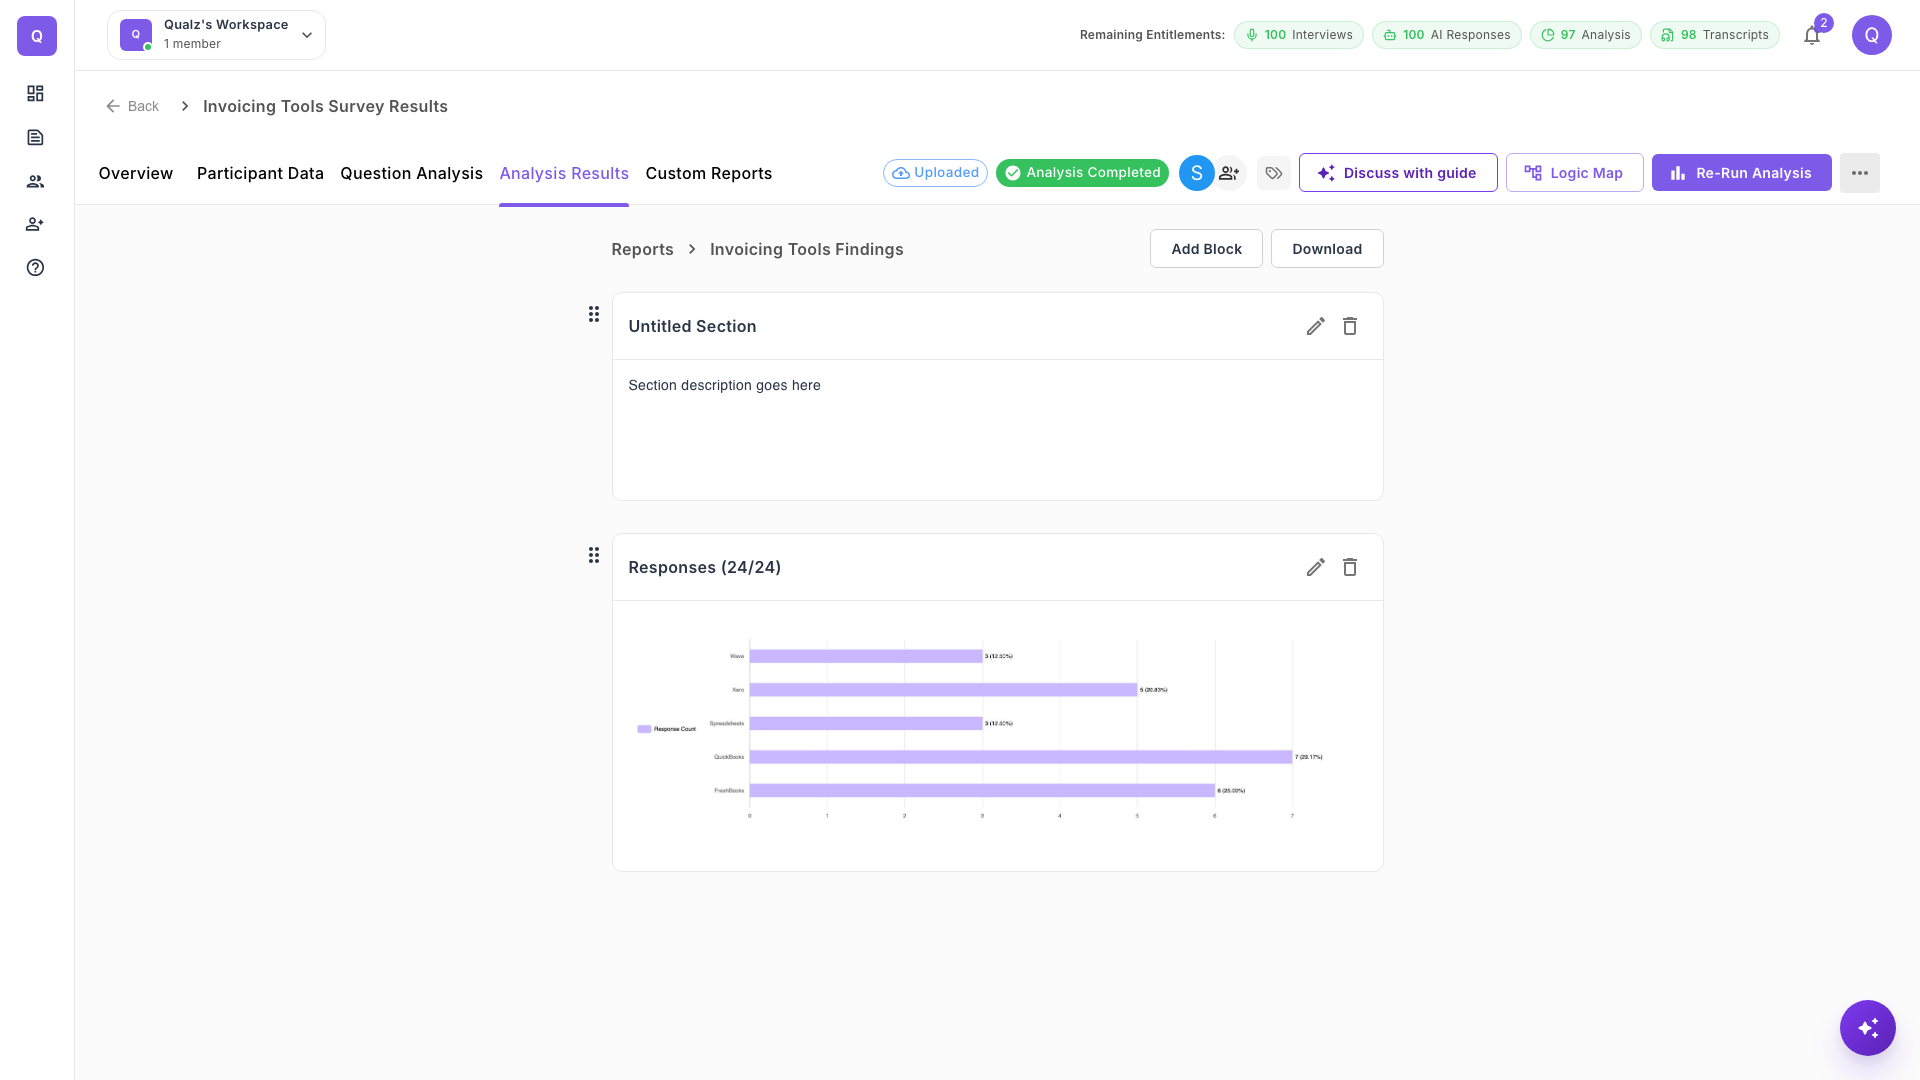
Inside a report you can:
- Click Add Block to add a new section with a title and description.
- Click the pencil icon to edit a block, or the trash icon to delete it.
- Drag the handle beside a block to change the order.
- Click Download to save the report.
What to Include in Your Report
A clear report usually covers these sections:
Introduction
- Title and Subject: The focus of the survey.
- Target Audience: Who participated in the survey.
- Problem Statement: The issue or topic the survey addresses.
Methodology
- Survey Type: Whether it focused on numbers, insights, or both.
- Question Formats: Closed-ended and open-ended questions used.
- Participation Details: The number of people who completed the survey.
Key Findings
- Quantitative Results: Statistics and percentages.
- Qualitative Insights: Themes and opinions shared by participants.
Conclusion
- Overall Results: The main takeaways from the survey.
- Emphasis Points: The findings that matter most.
- Improvement Areas: Where action is needed.
Recommendations & Action Items
- Specific next steps based on the findings.
For guidance on writing clear findings, see Research Findings.