How to Analyze a Survey
Survey analysis in Qualz.ai shows how your survey is doing and what participants said, with insights on responses, participant data and each question. You can also build your own reports from the results.
Open Your Survey Results
Once your survey has responses, you can open its results in two ways:
- Click the notification under the bell icon when the analysis of new responses completes.
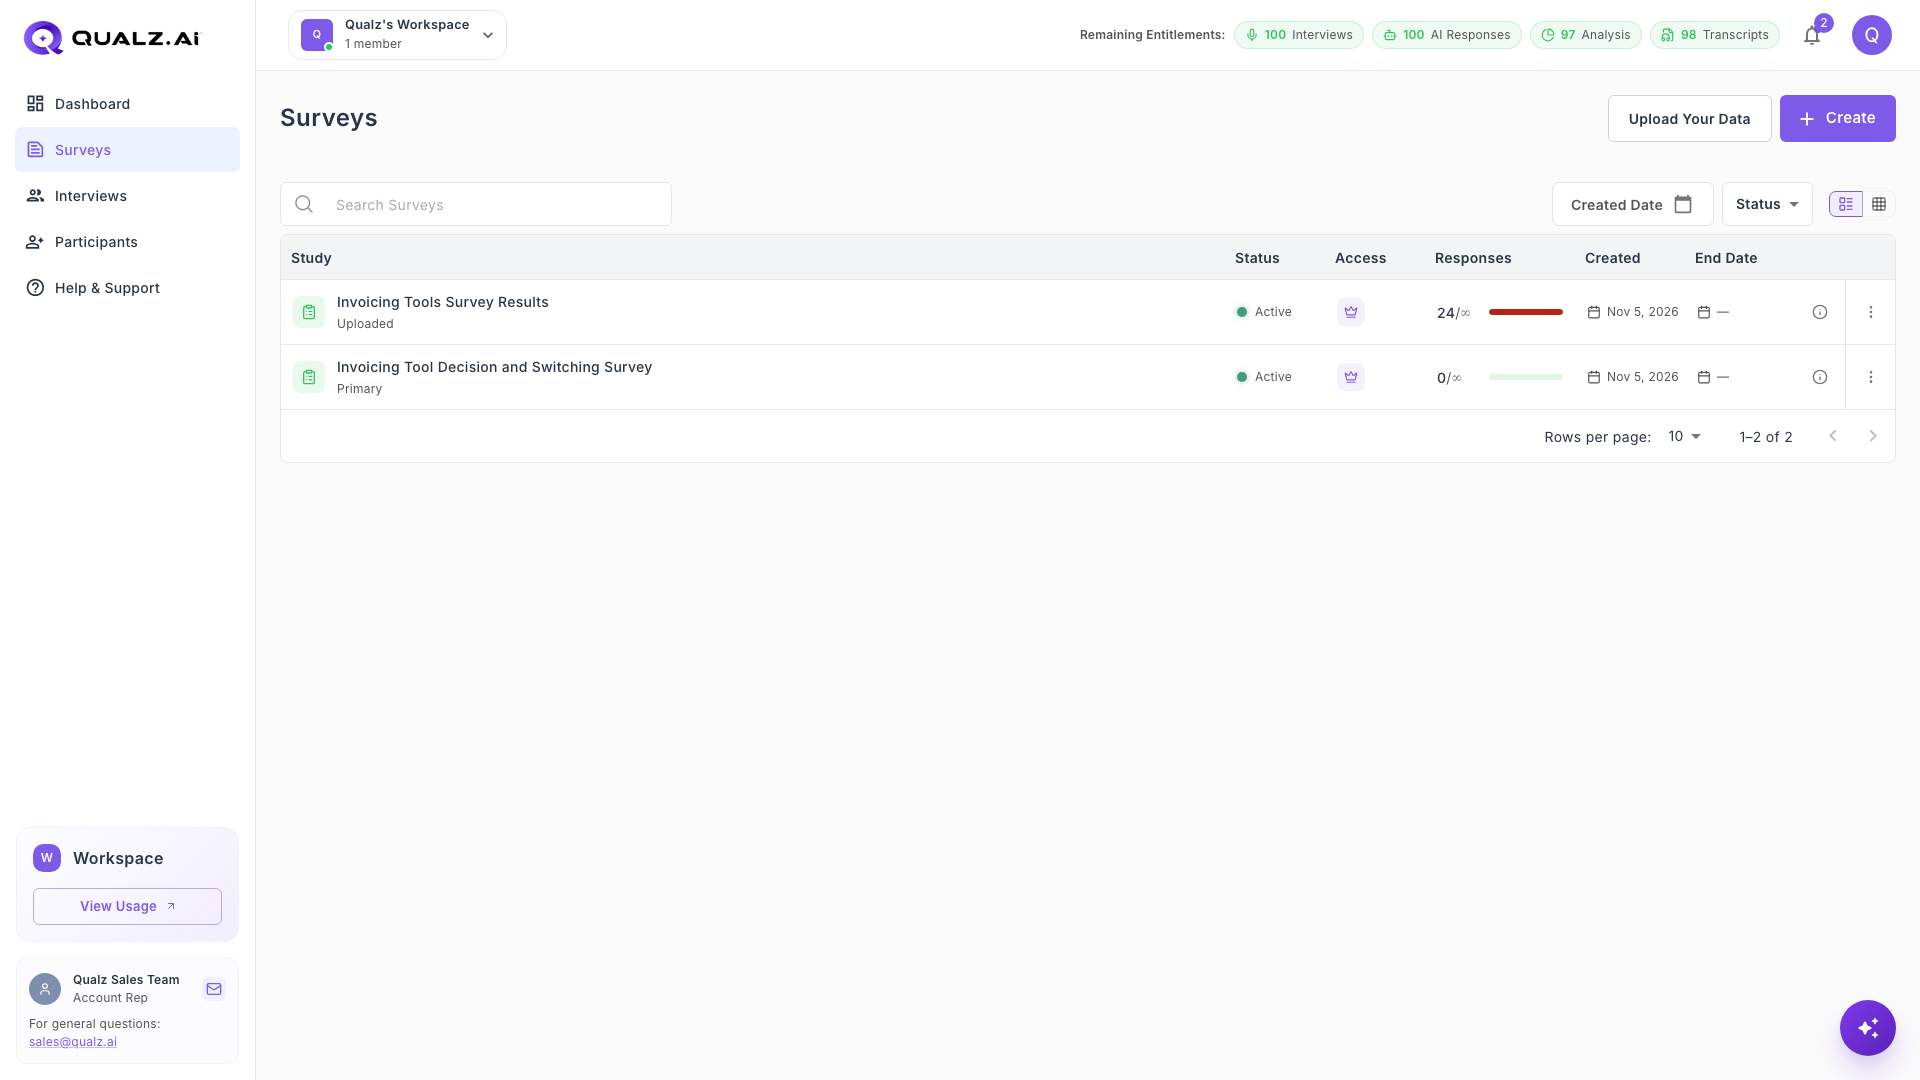
- Click the survey in the list on the Surveys page.
What's on the Results Page?
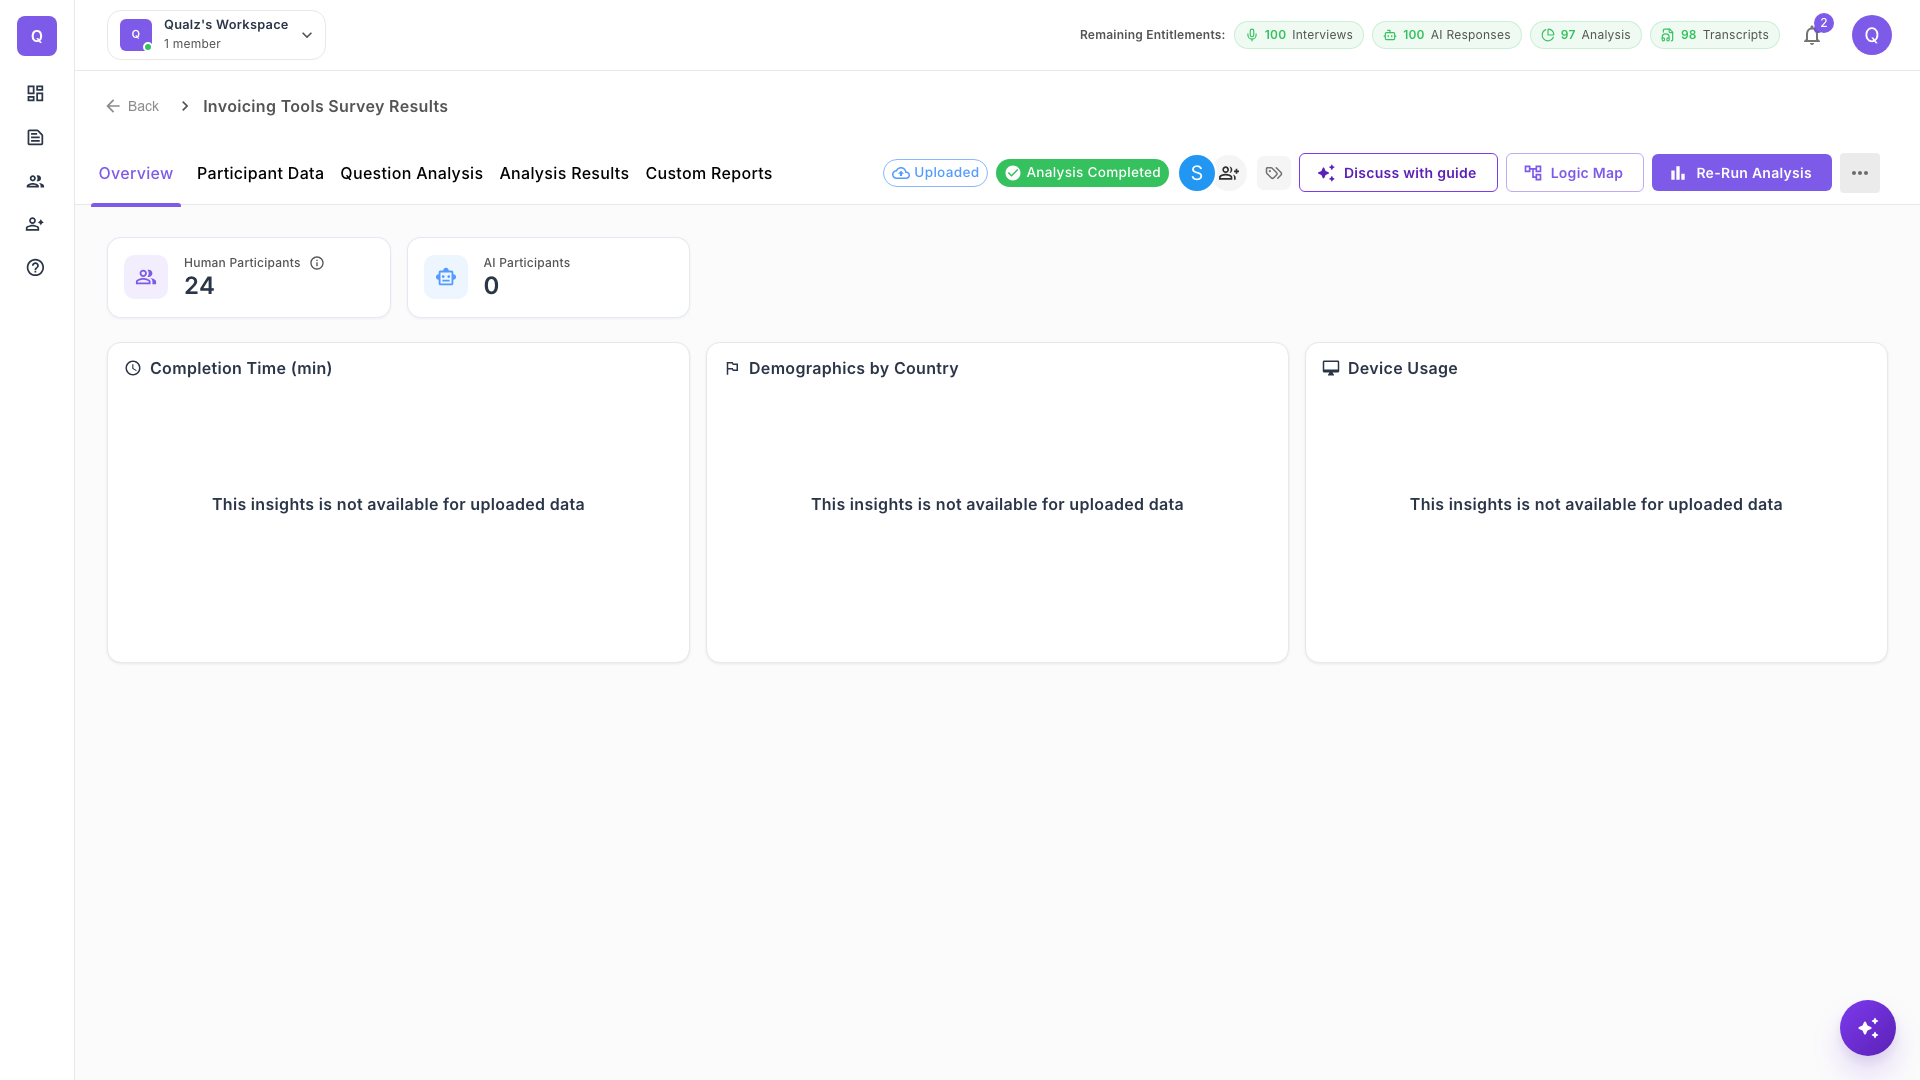
The results page has five tabs across the top:
- Overview
- Participant Data
- Question Analysis
- Analysis Results
- Custom Reports
Next to the tabs, a badge shows the analysis status, such as Analysis Completed. You'll also find Discuss with guide, which opens the Research Guide with this survey attached, and Logic Map.
Pro Tip
Click Run Analysis to analyze your responses. Once a survey has been analyzed, the button becomes Re-Run Analysis, which you can use after new responses have come in. Analysis uses Analysis Units.
Overview
The Overview tab shows how your survey is performing:
- Human Participants: How many real people have responded.
- AI Participants: Responses collected from AI-generated participants.
- Completion Time (min): How long participants took to complete your survey.
- Demographics by Country: Where your respondents are located.
- Device Usage: Which devices were used to take your survey.
Completion time, country and device are not available for uploaded data, as the example below shows.
Note: If your survey uses Screener Questions, screened-out participants are tracked separately. Analysis denominators adjust to show only participants who were shown each question, giving you accurate percentages.
Participant Data
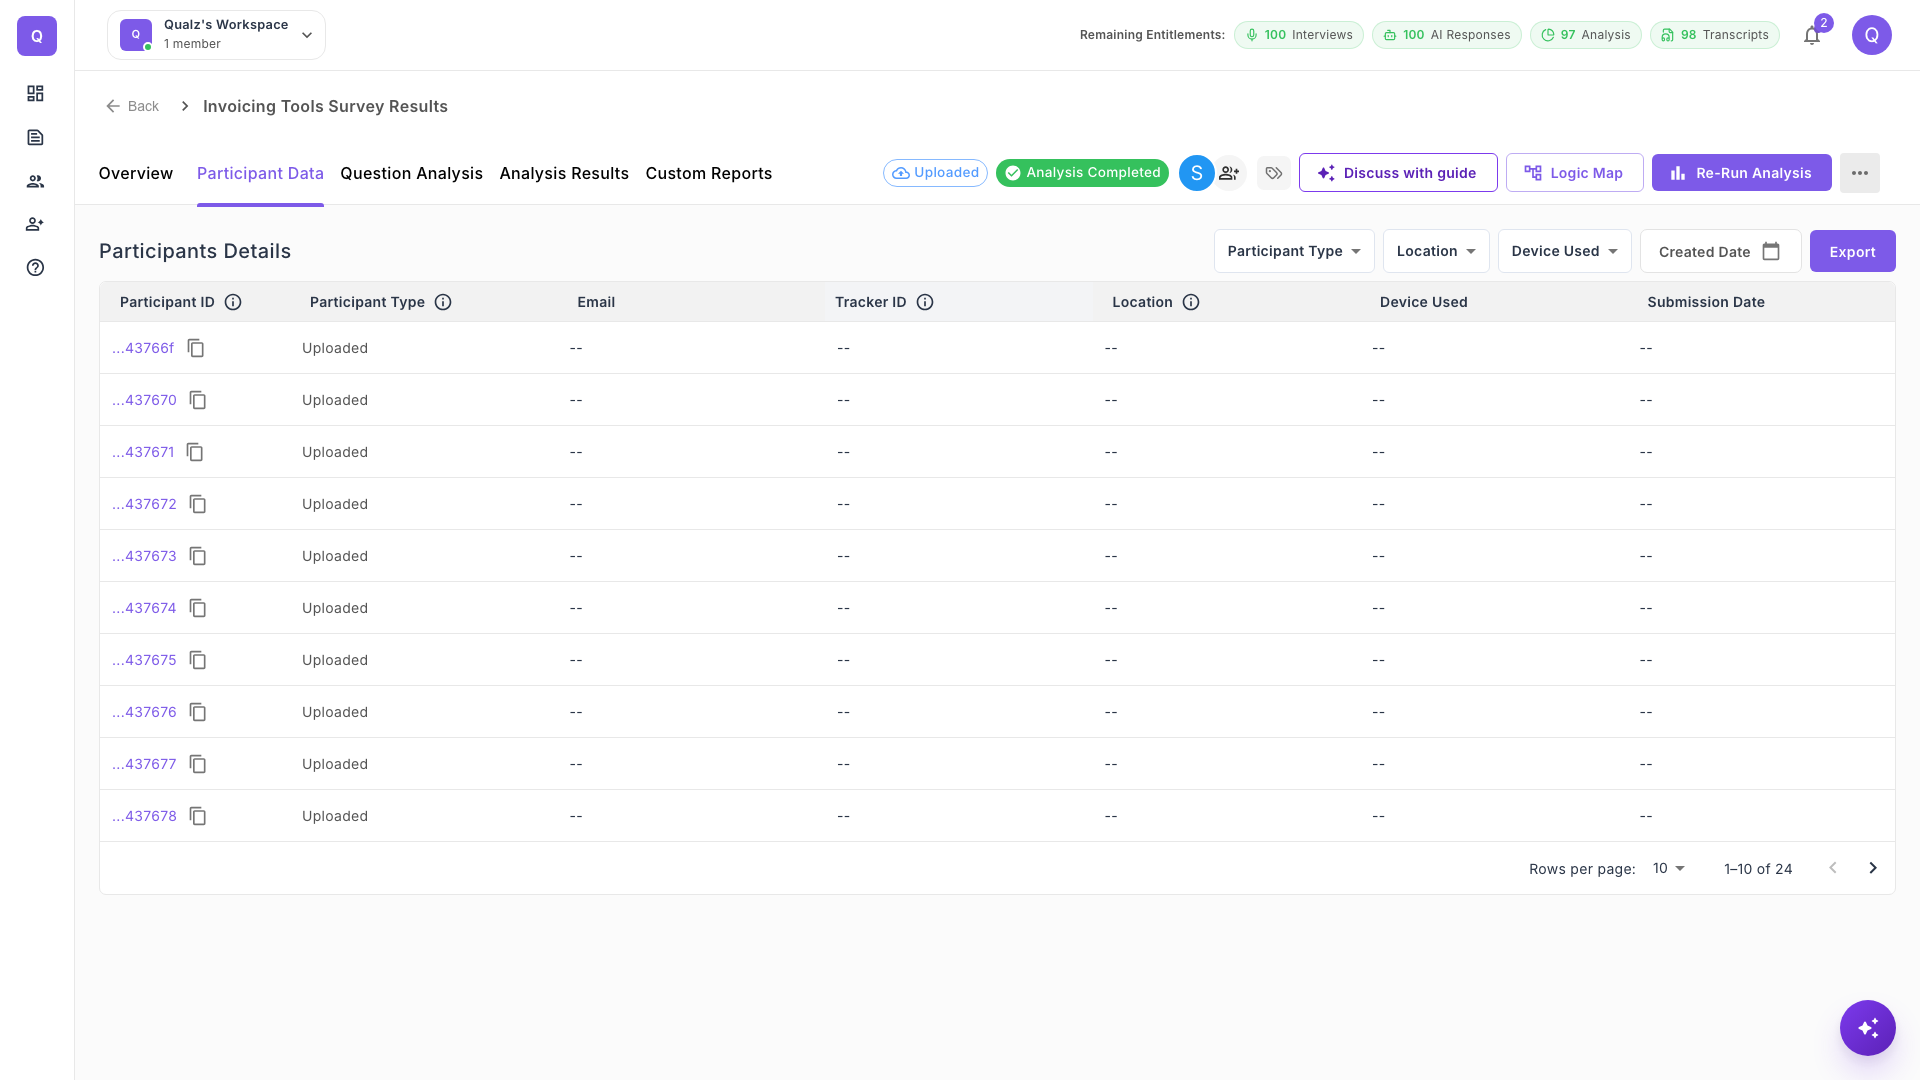
The Participant Data tab gives you a closer look at who is responding. For each participant you'll find:
- Participant ID: A unique identifier for the participant.
- Participant Type: Where the response came from, such as a human or AI participant, or an uploaded file.
- Email: The participant's email, if you asked for it.
- Tracker ID: The ID passed in by a panel, if you use one.
- Location: Where the participant is located.
- Device Used: Which device the participant used.
- Submission Date: When the response was submitted.
Use the filters above the table to narrow the data by Participant Type, Location, Device Used or Created Date, and click Export to download it.
Viewing Individual Responses
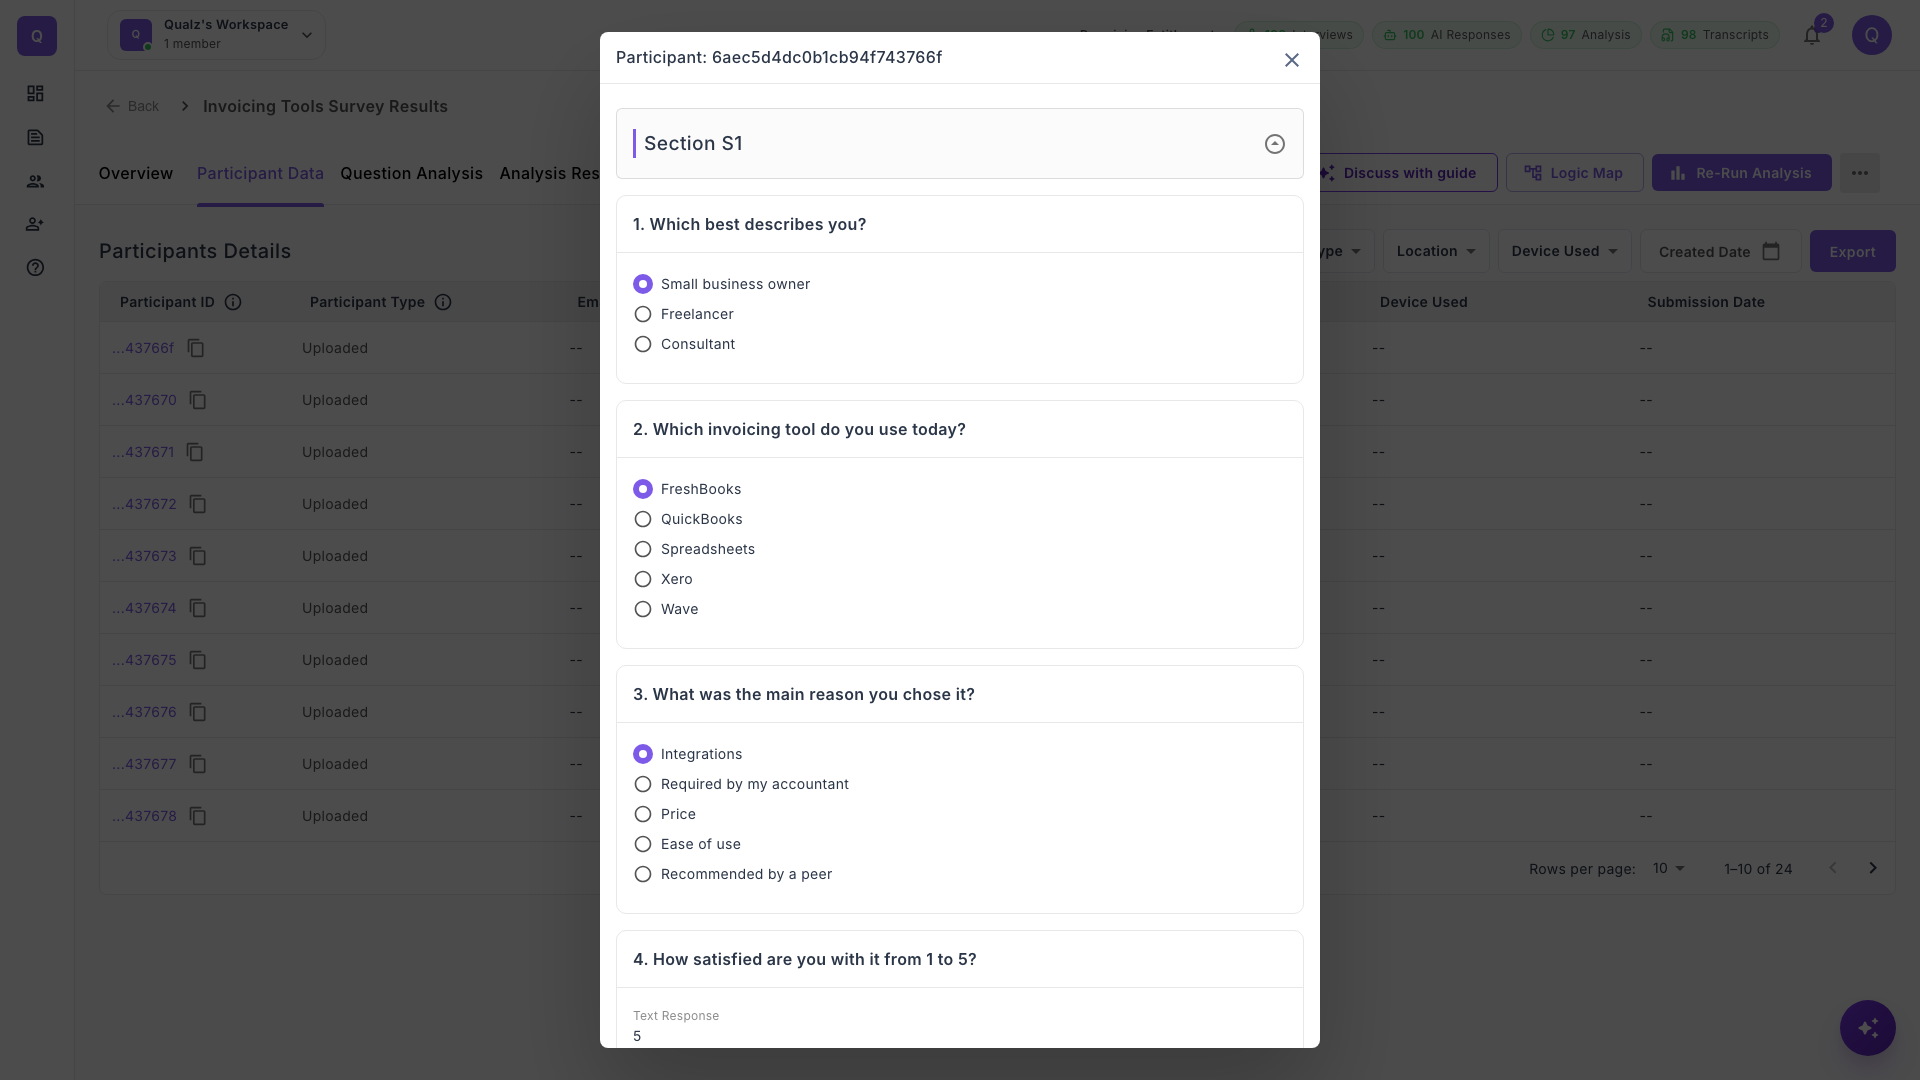
Click a Participant ID to open that participant's answers to every survey question.
Question Analysis
The Question Analysis tab lets you analyze the responses to each question individually.
- The left panel shows the Survey Overview: the survey's sections and questions. Its download icon exports the survey responses as a CSV file.
- Click a question to open it on the right. The panel shows the question text, its type, and how many participants it was shown to.
- Use the Language menu at the top right to choose the language of the results.
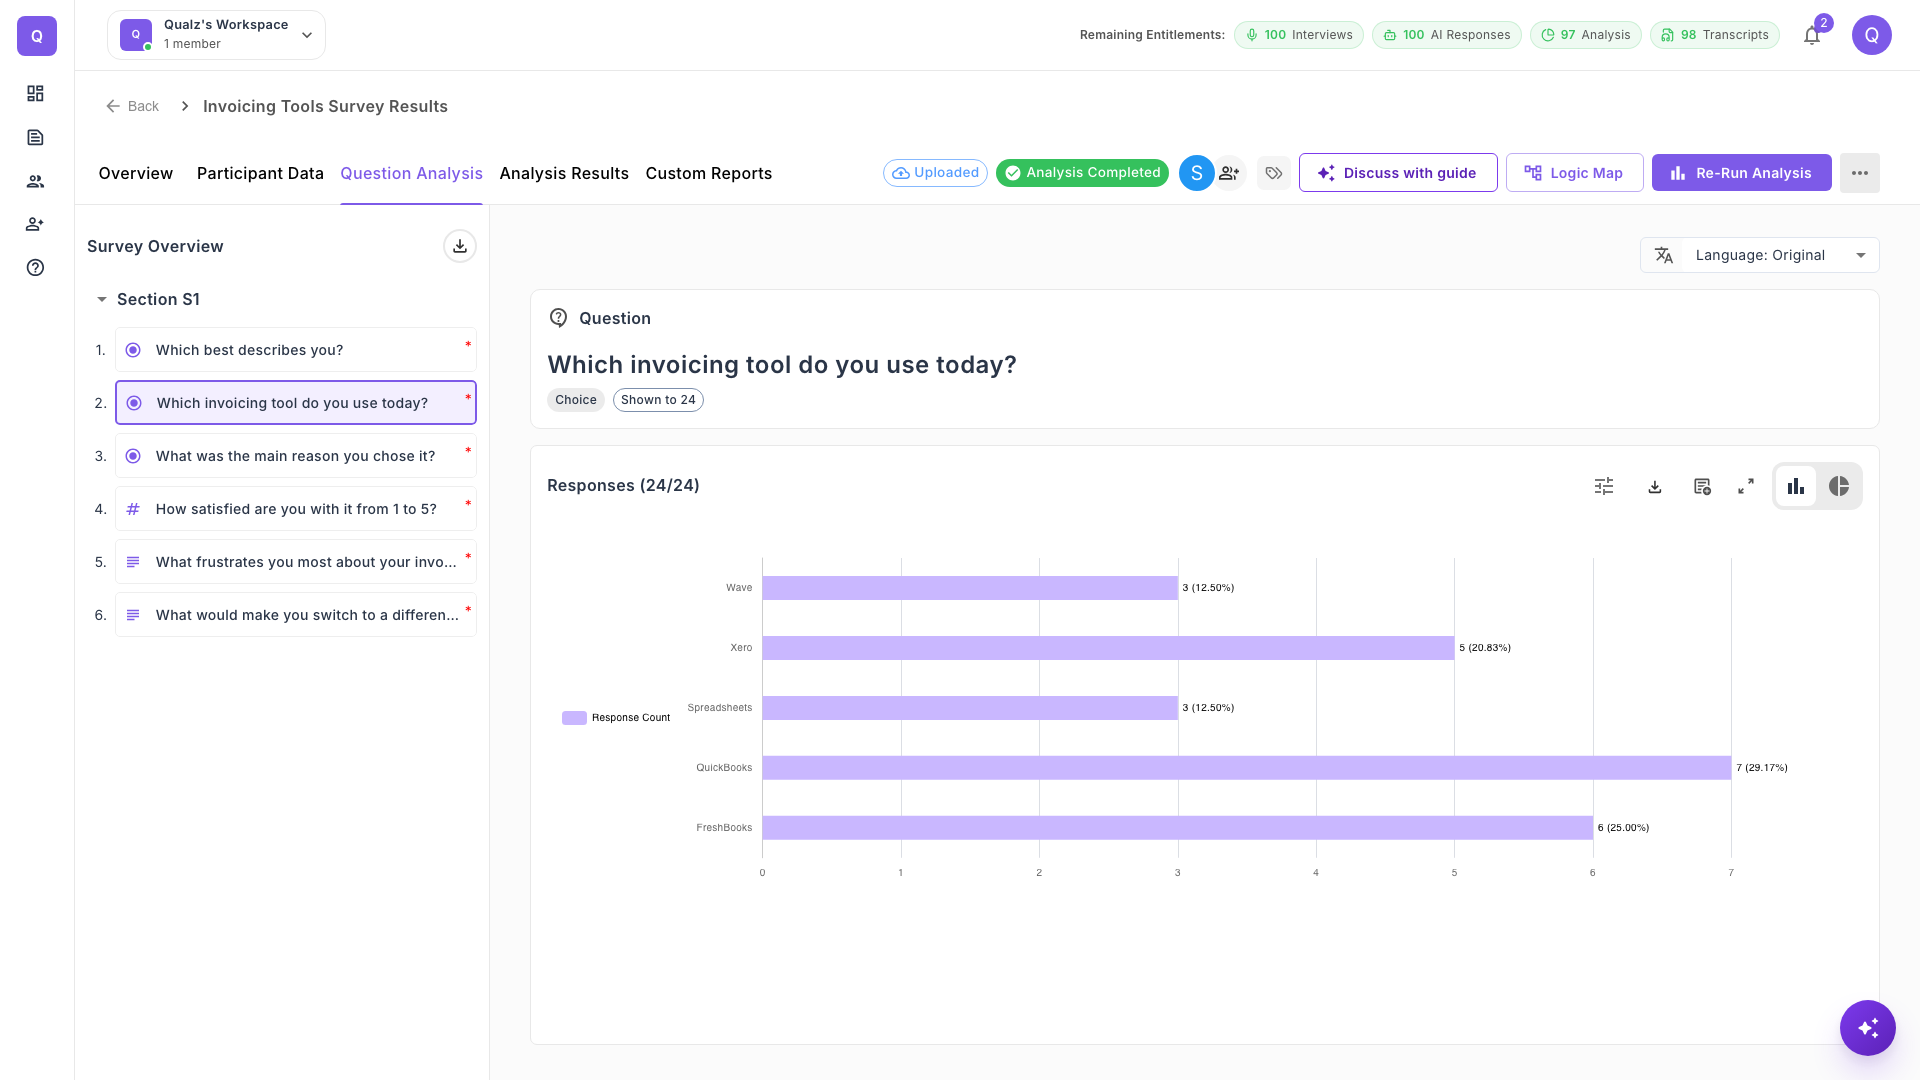
For closed questions, the Responses panel shows a chart. The icons at the top right let you customize the chart, export it as a PNG, add it to a custom report or expand it. You can switch between a bar chart and a pie chart.
Grid / Matrix and Ranking Analysis
For Grid / Matrix questions, the analysis shows a frequency table with row-by-column breakdowns, heatmap visualizations, and stacked bar charts for each row. For Ranking questions, it shows mean rank scores, position frequency, and Borda score rankings.
If your survey uses Stimulus Images, the attached image is displayed alongside the question results for visual context.
Qualitative Analysis
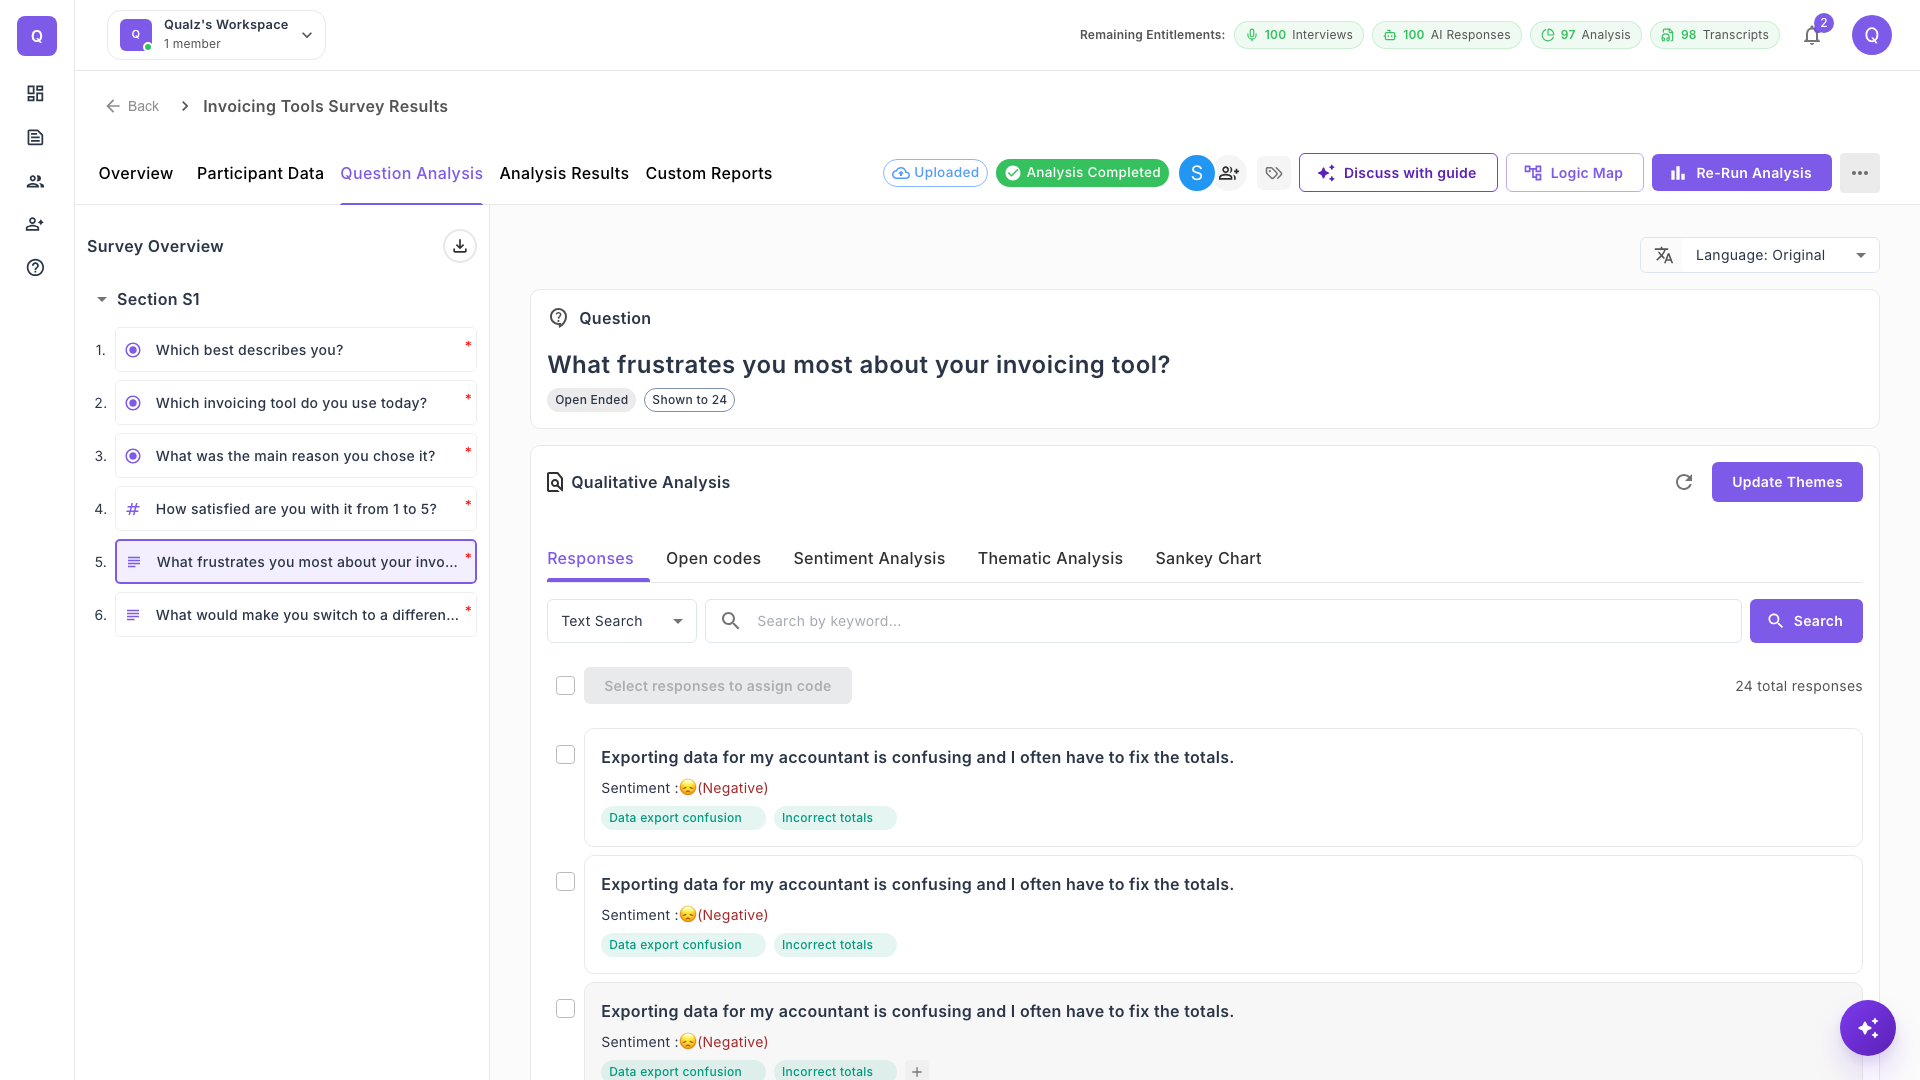
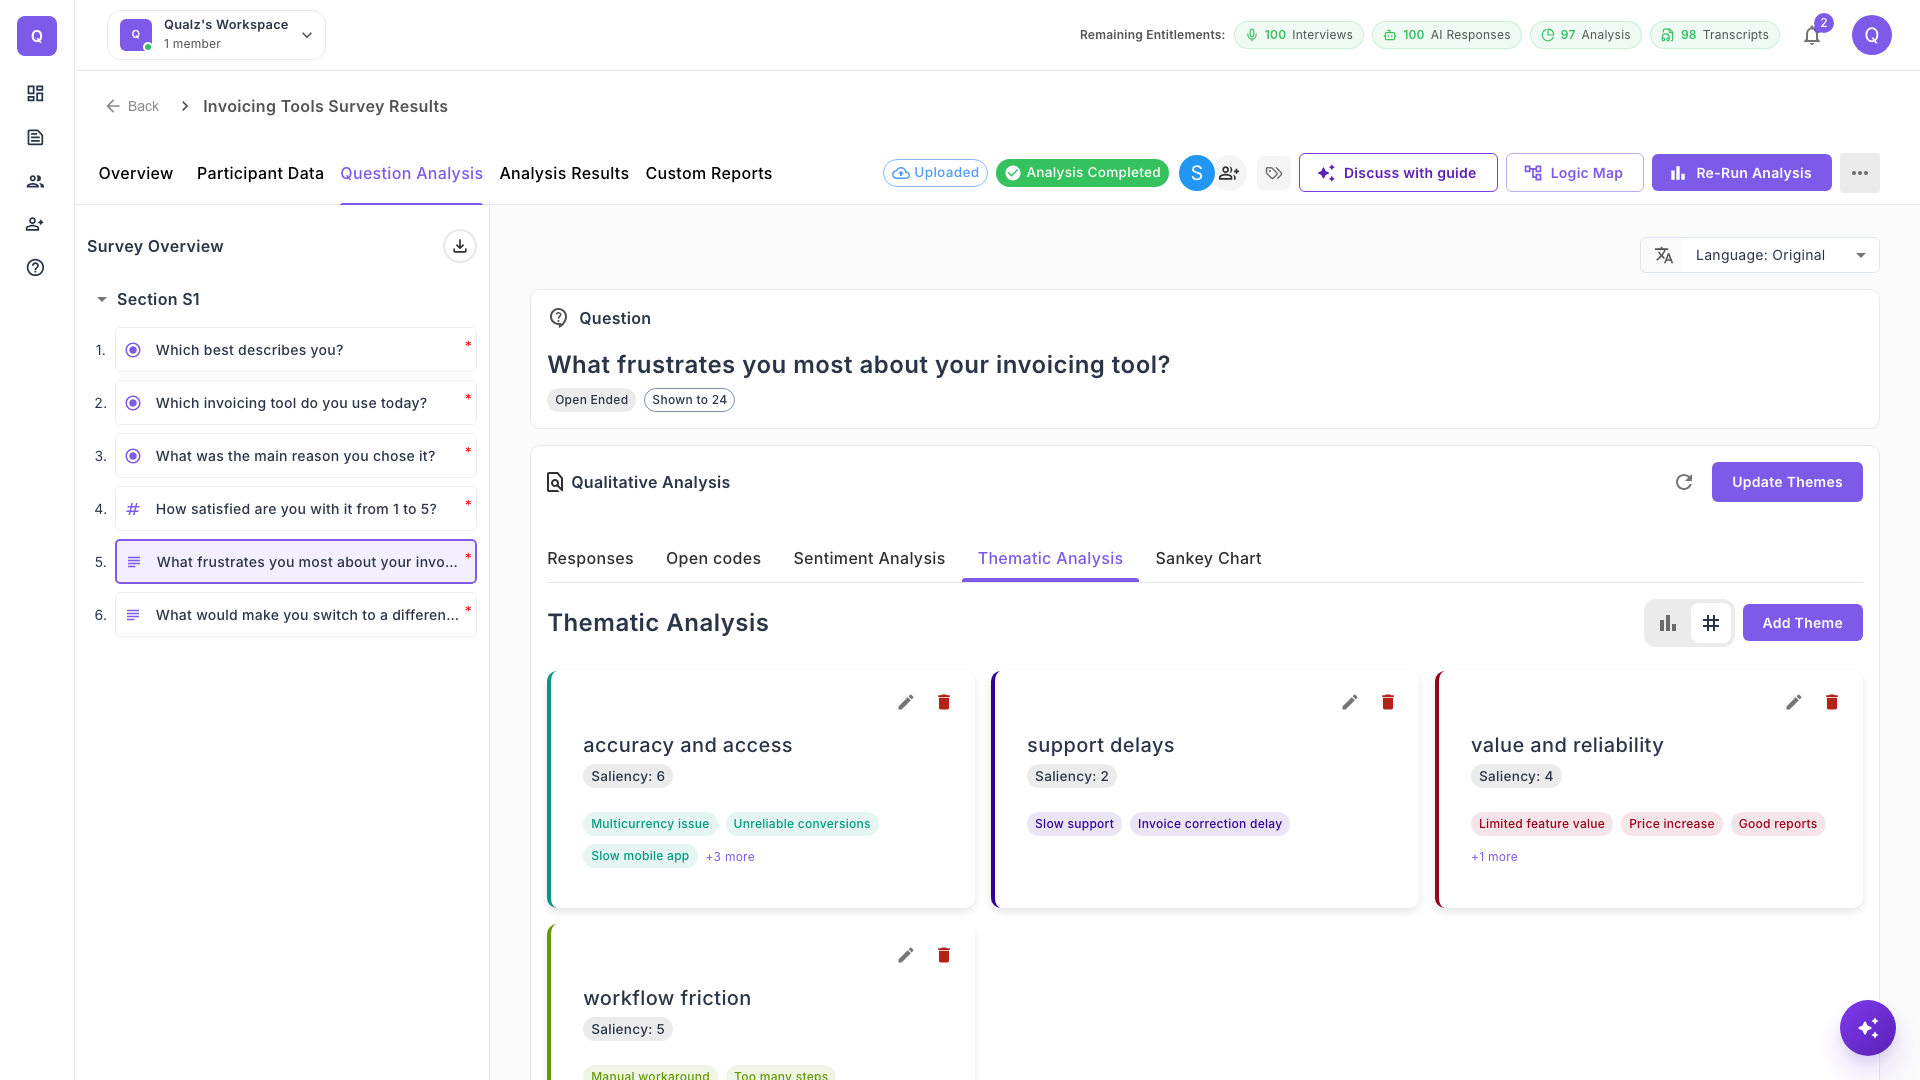
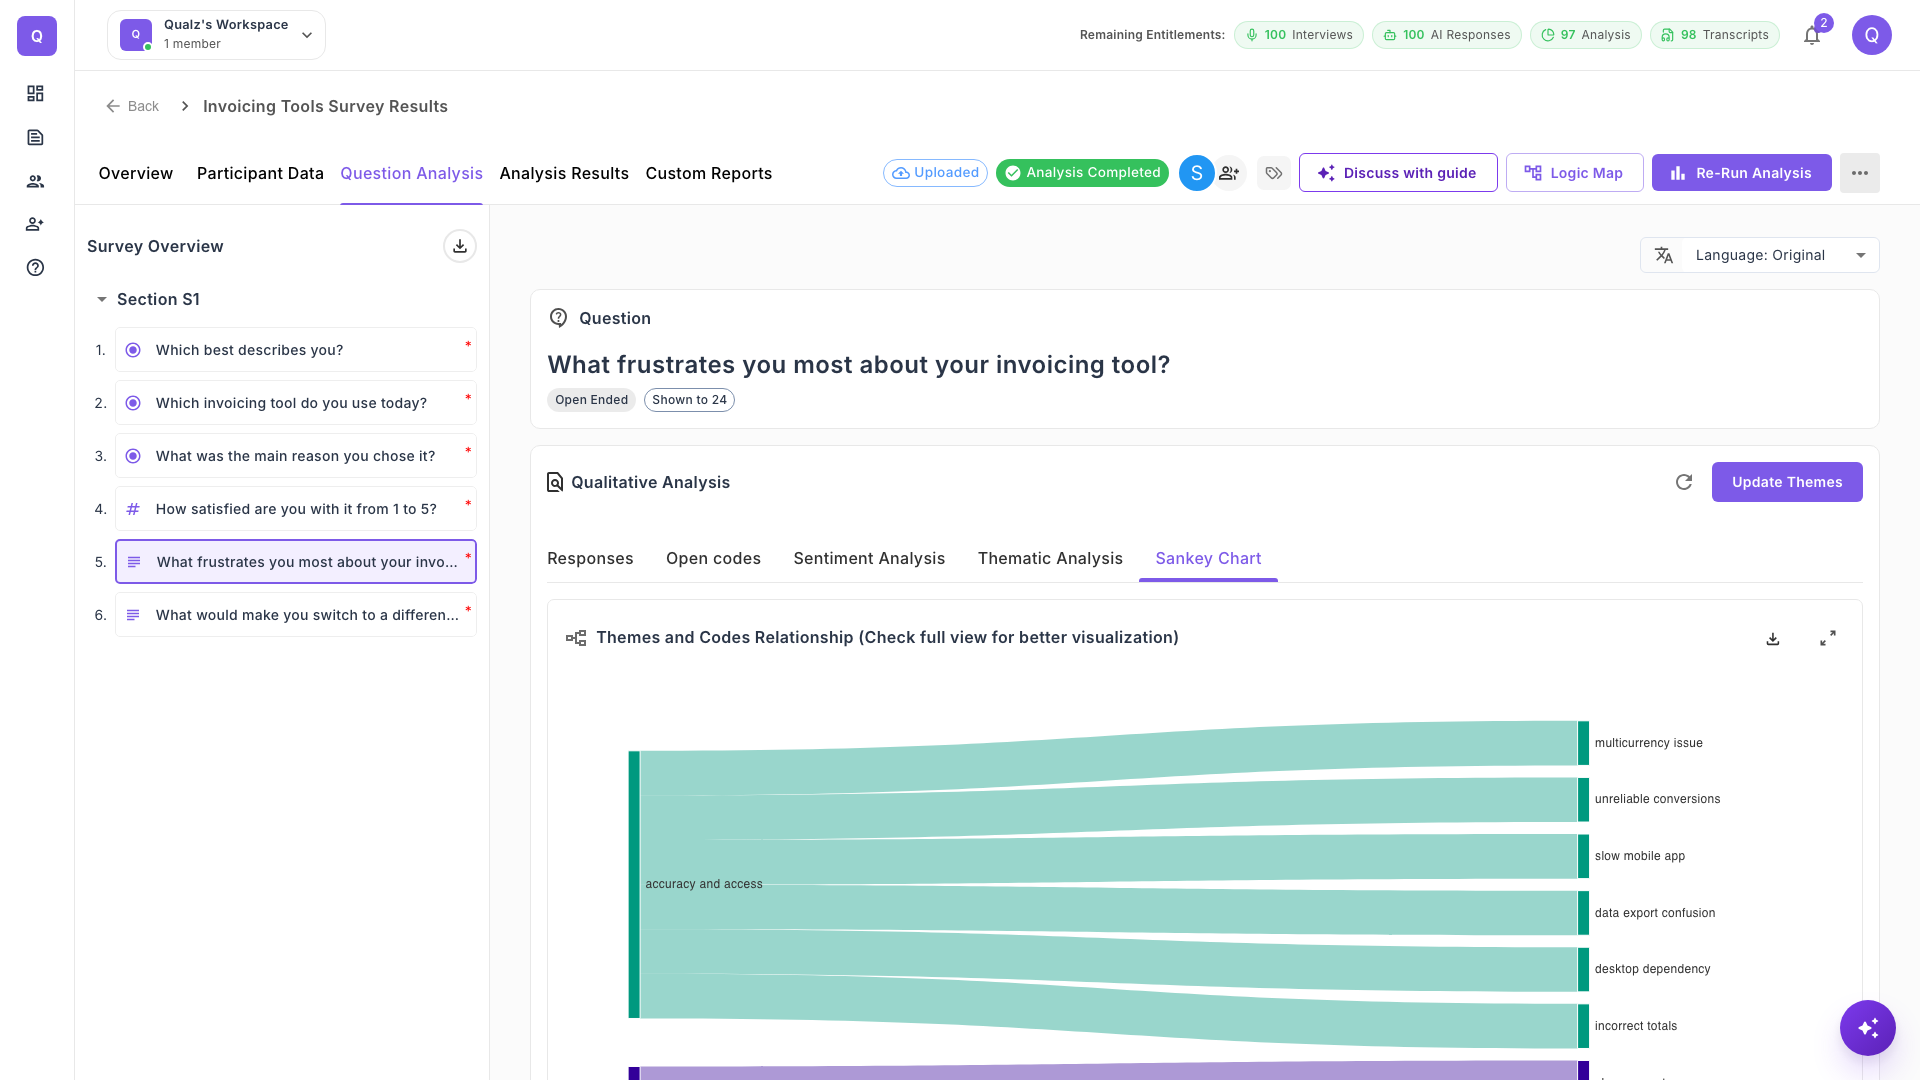
For open-ended questions, a Qualitative Analysis panel shows what participants actually said, through five tabs: Responses, Open codes, Sentiment Analysis, Thematic Analysis and Sankey Chart. Click Update Themes to apply any changes you make to themes or codes.
Responses
Each answer appears with its sentiment and codes. Search the responses by keyword, or tick responses and click Select responses to assign code to code them yourself.
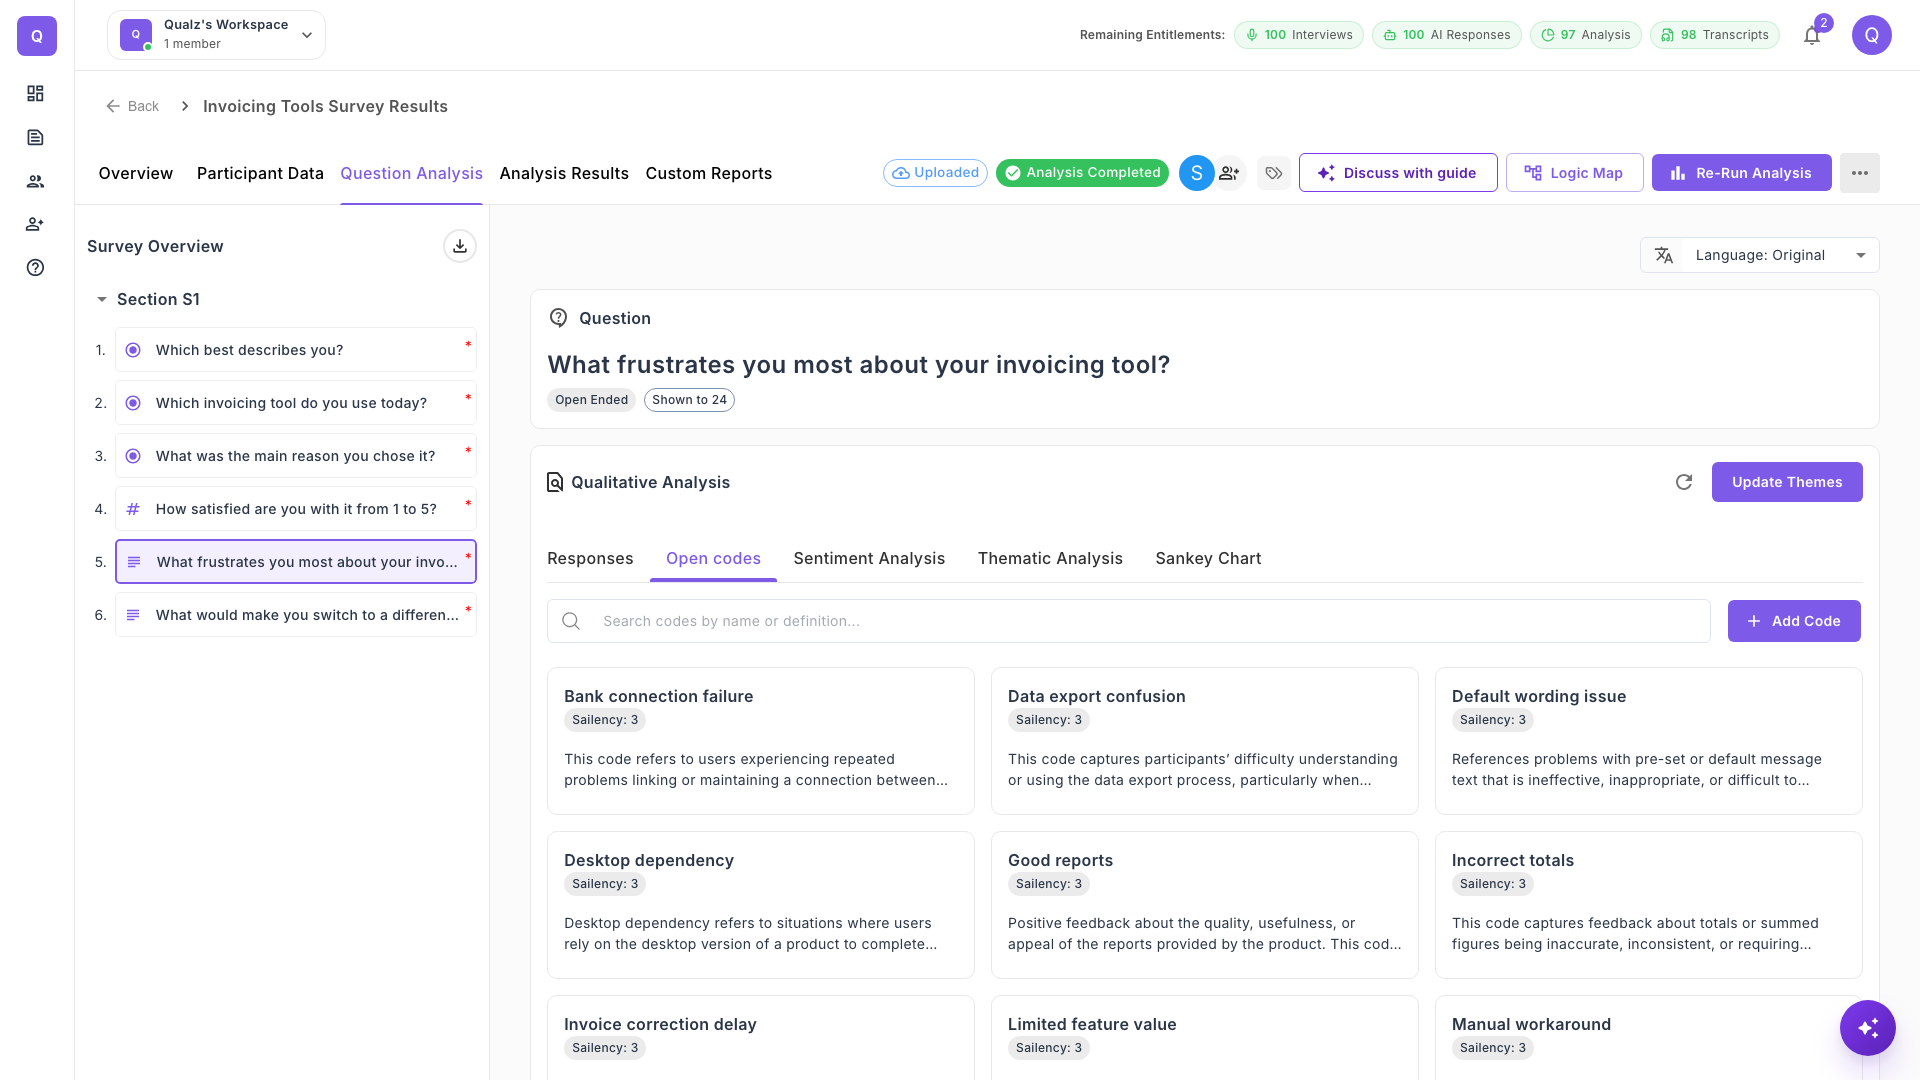
Open codes
Every code with its saliency and definition. Search the list, or click Add Code to create your own.
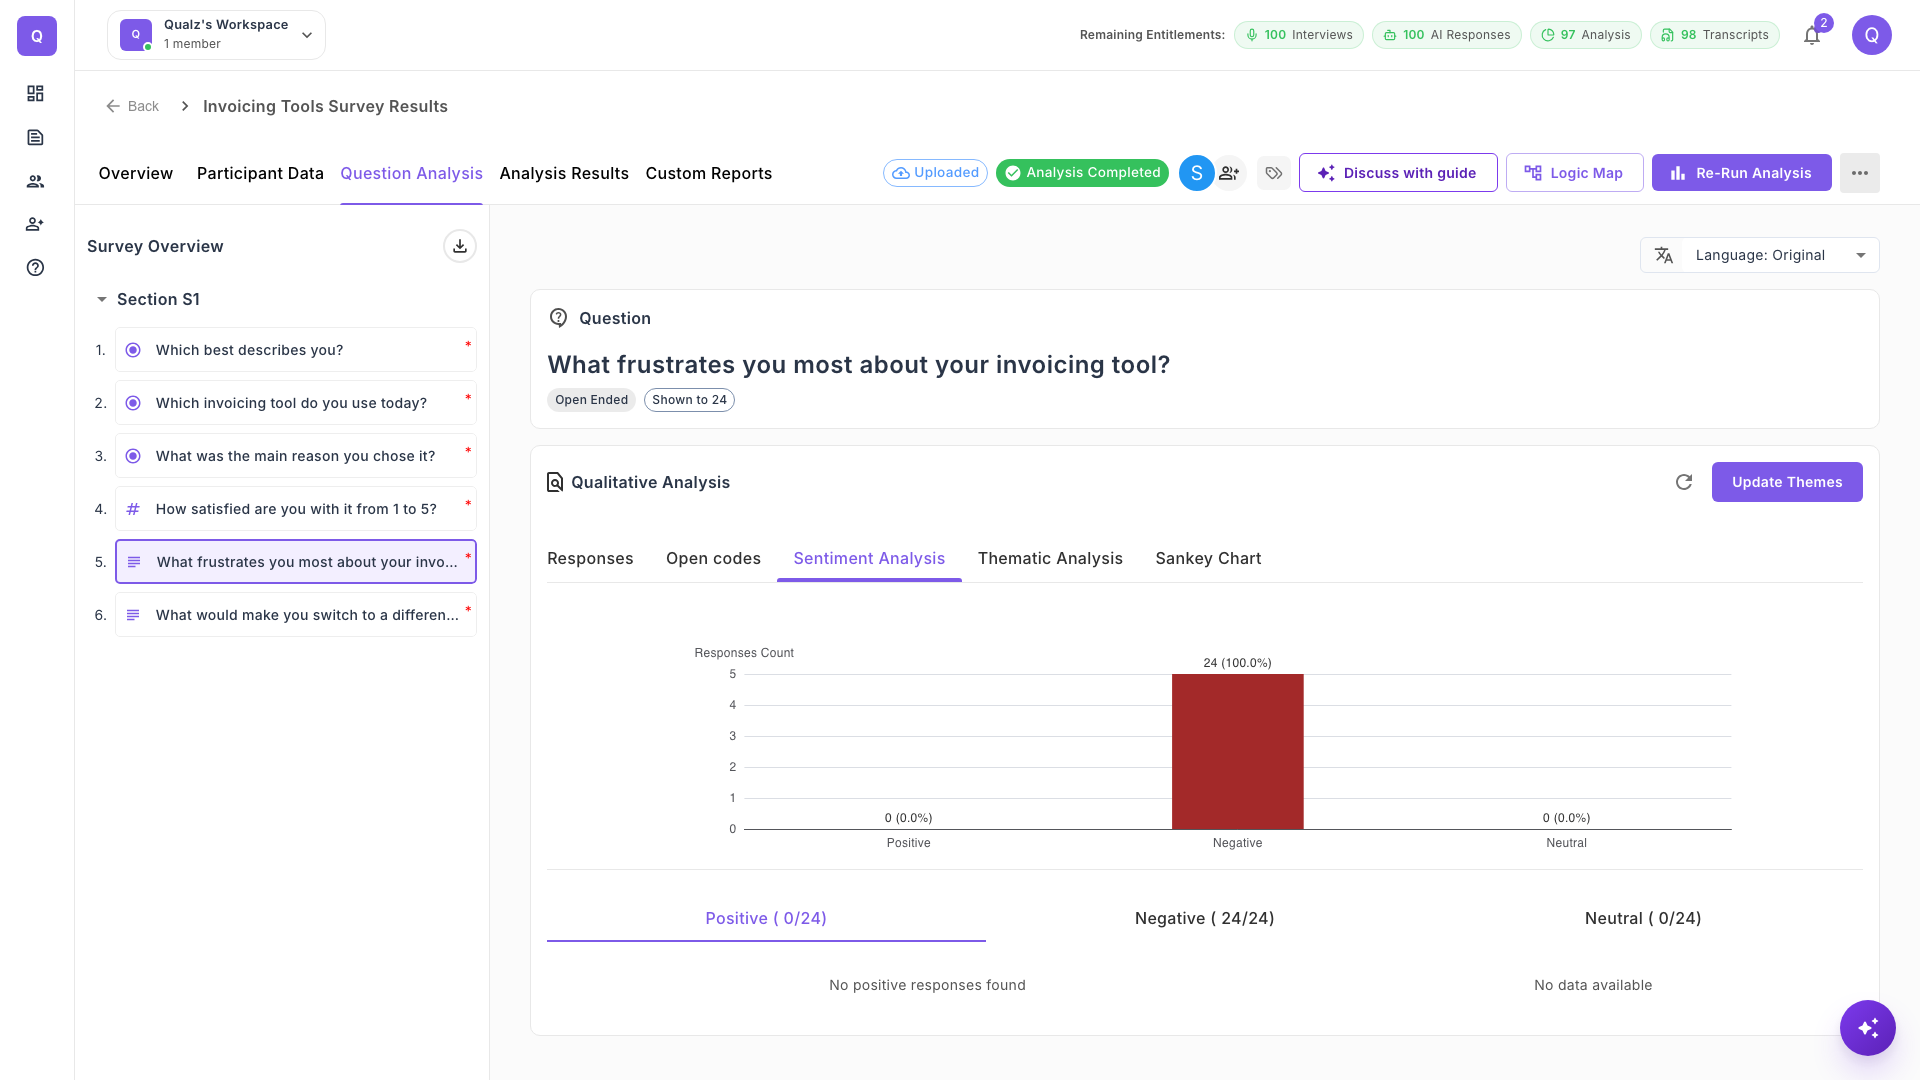
Sentiment Analysis
How the sentiment of the responses is distributed.
Thematic Analysis
Your data broken down into themes and codes, shown as a chart or as cards. You can also add a new theme.
Sankey Chart
A chart of how themes connect to codes. Use the icons at the top right to download it or expand it to full screen.
Analysis Results
The Analysis Results tab shows the Survey Overall Result, the AI-generated analysis for the survey as a whole.
Custom Reports
The Custom Reports tab is where you build your own reports from the results. See Survey Reports.
Watch the video walkthrough: How to analyze a survey in Qualz.ai